Want to know what the market looked like in March? Read on to learn more!
Highlights
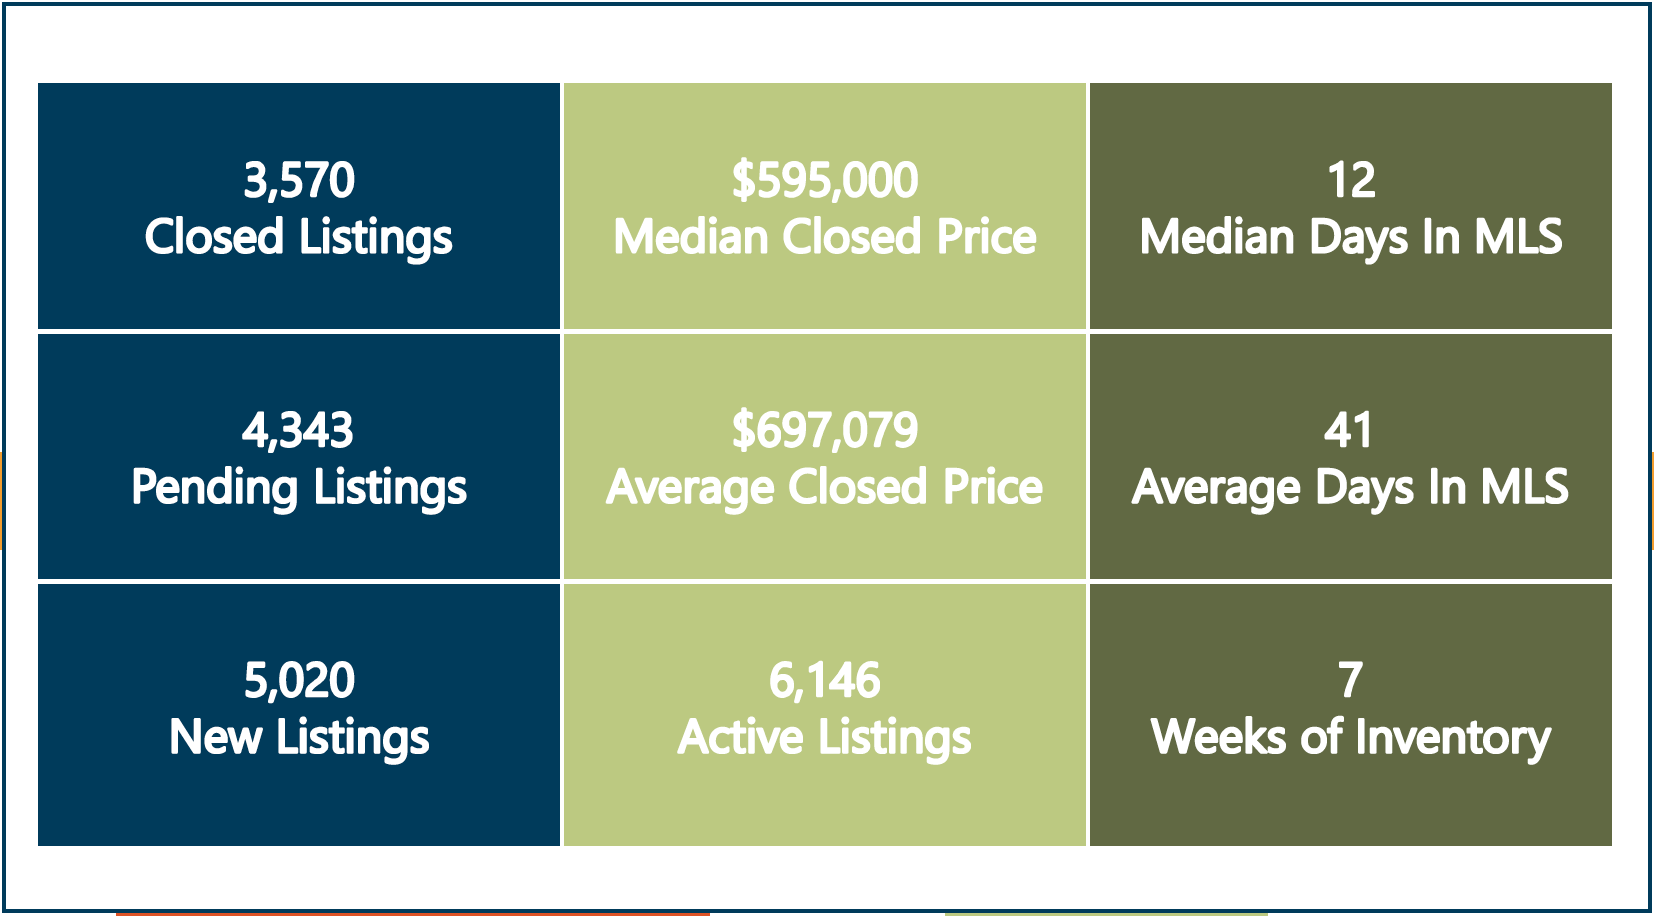
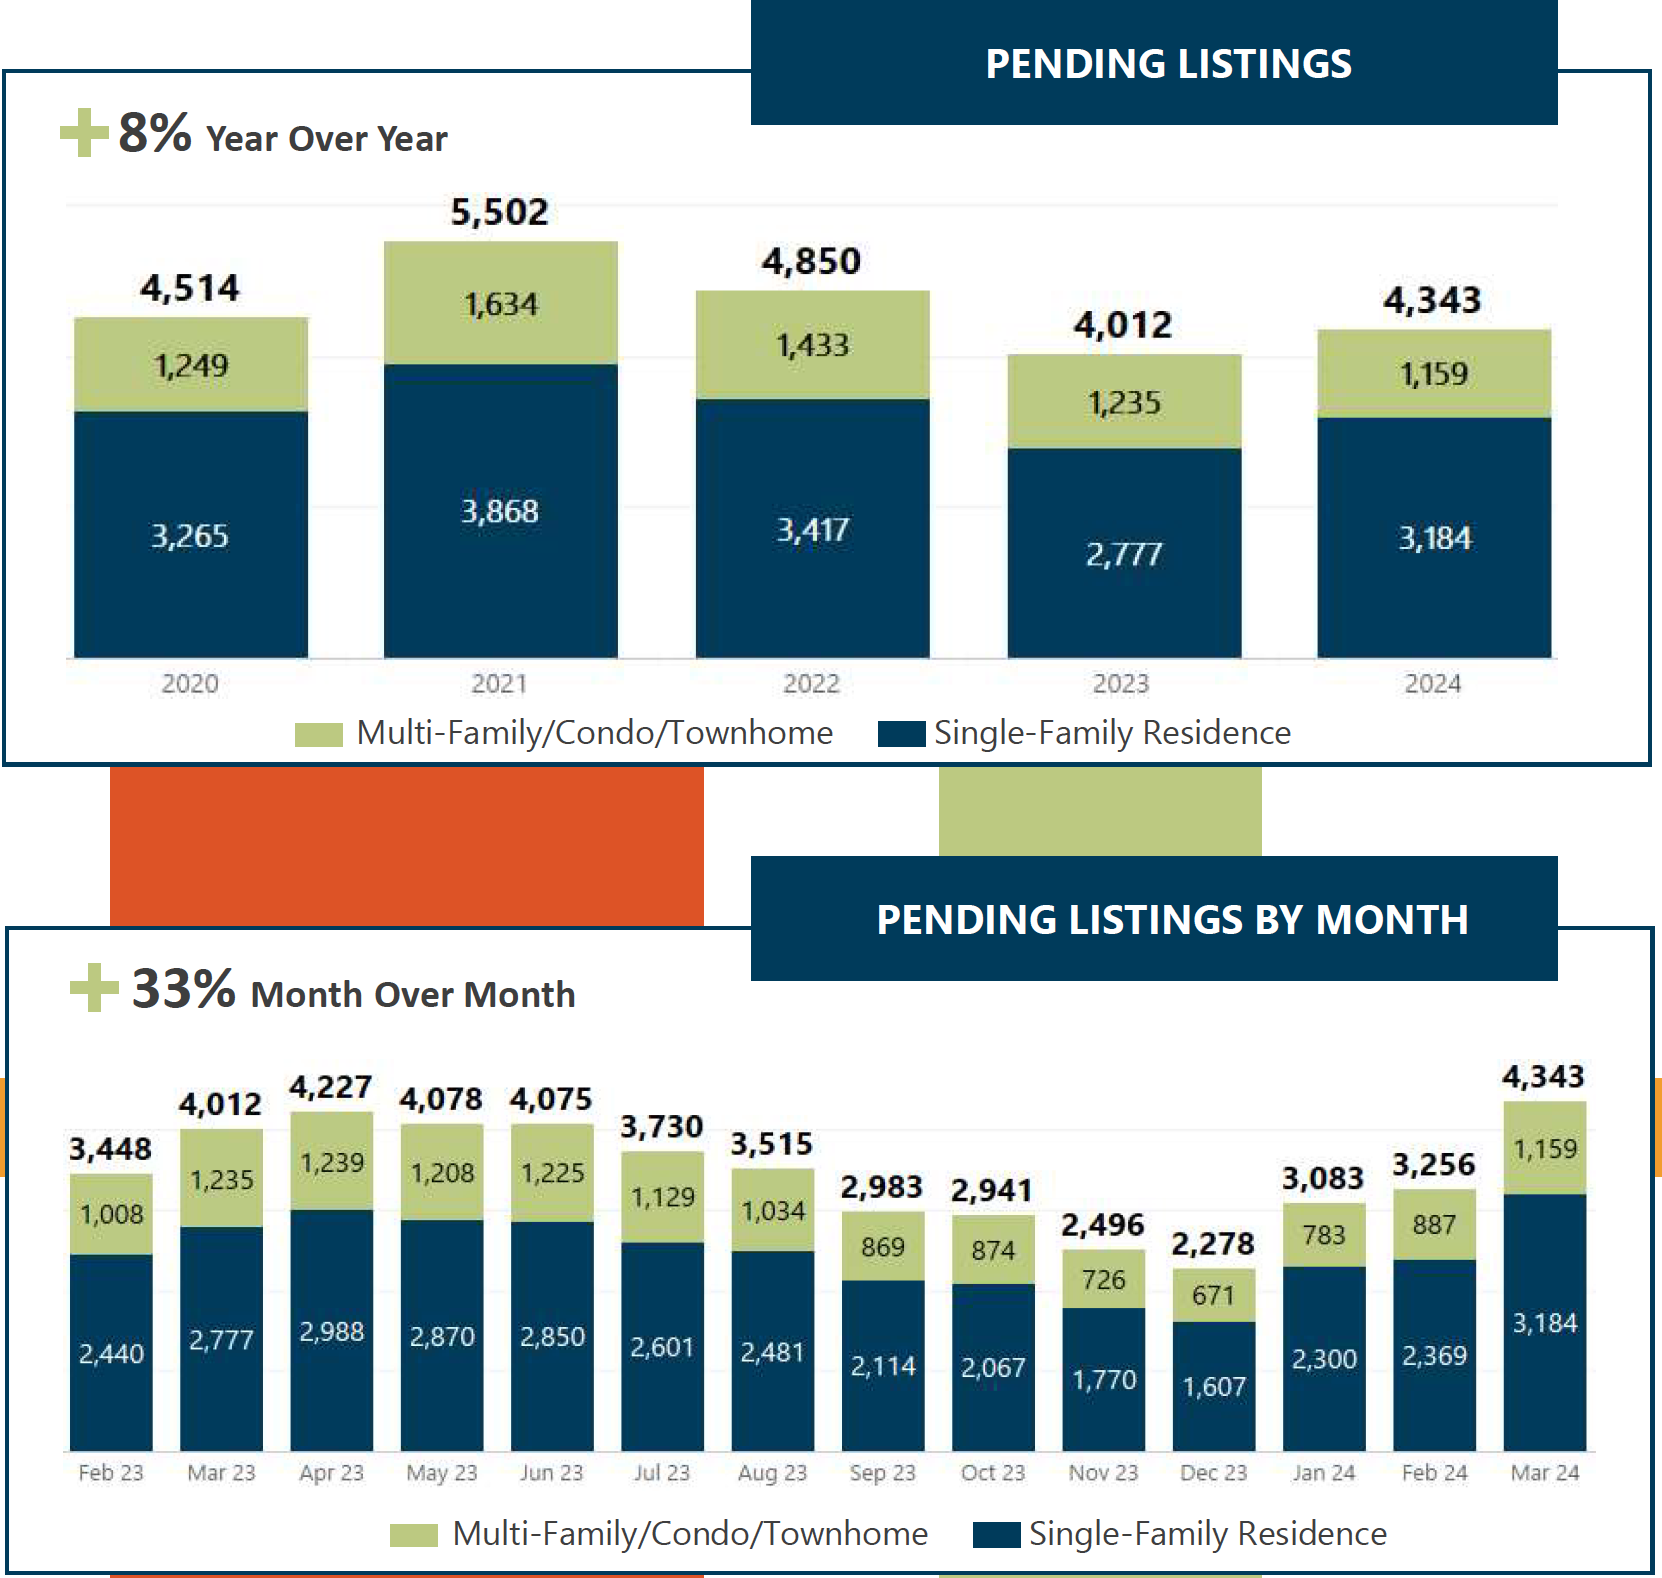
- In March, buyers continued to enter the market as 4,343 contracts were executed on homes. This is 8% more than last year and 33% more than last month.
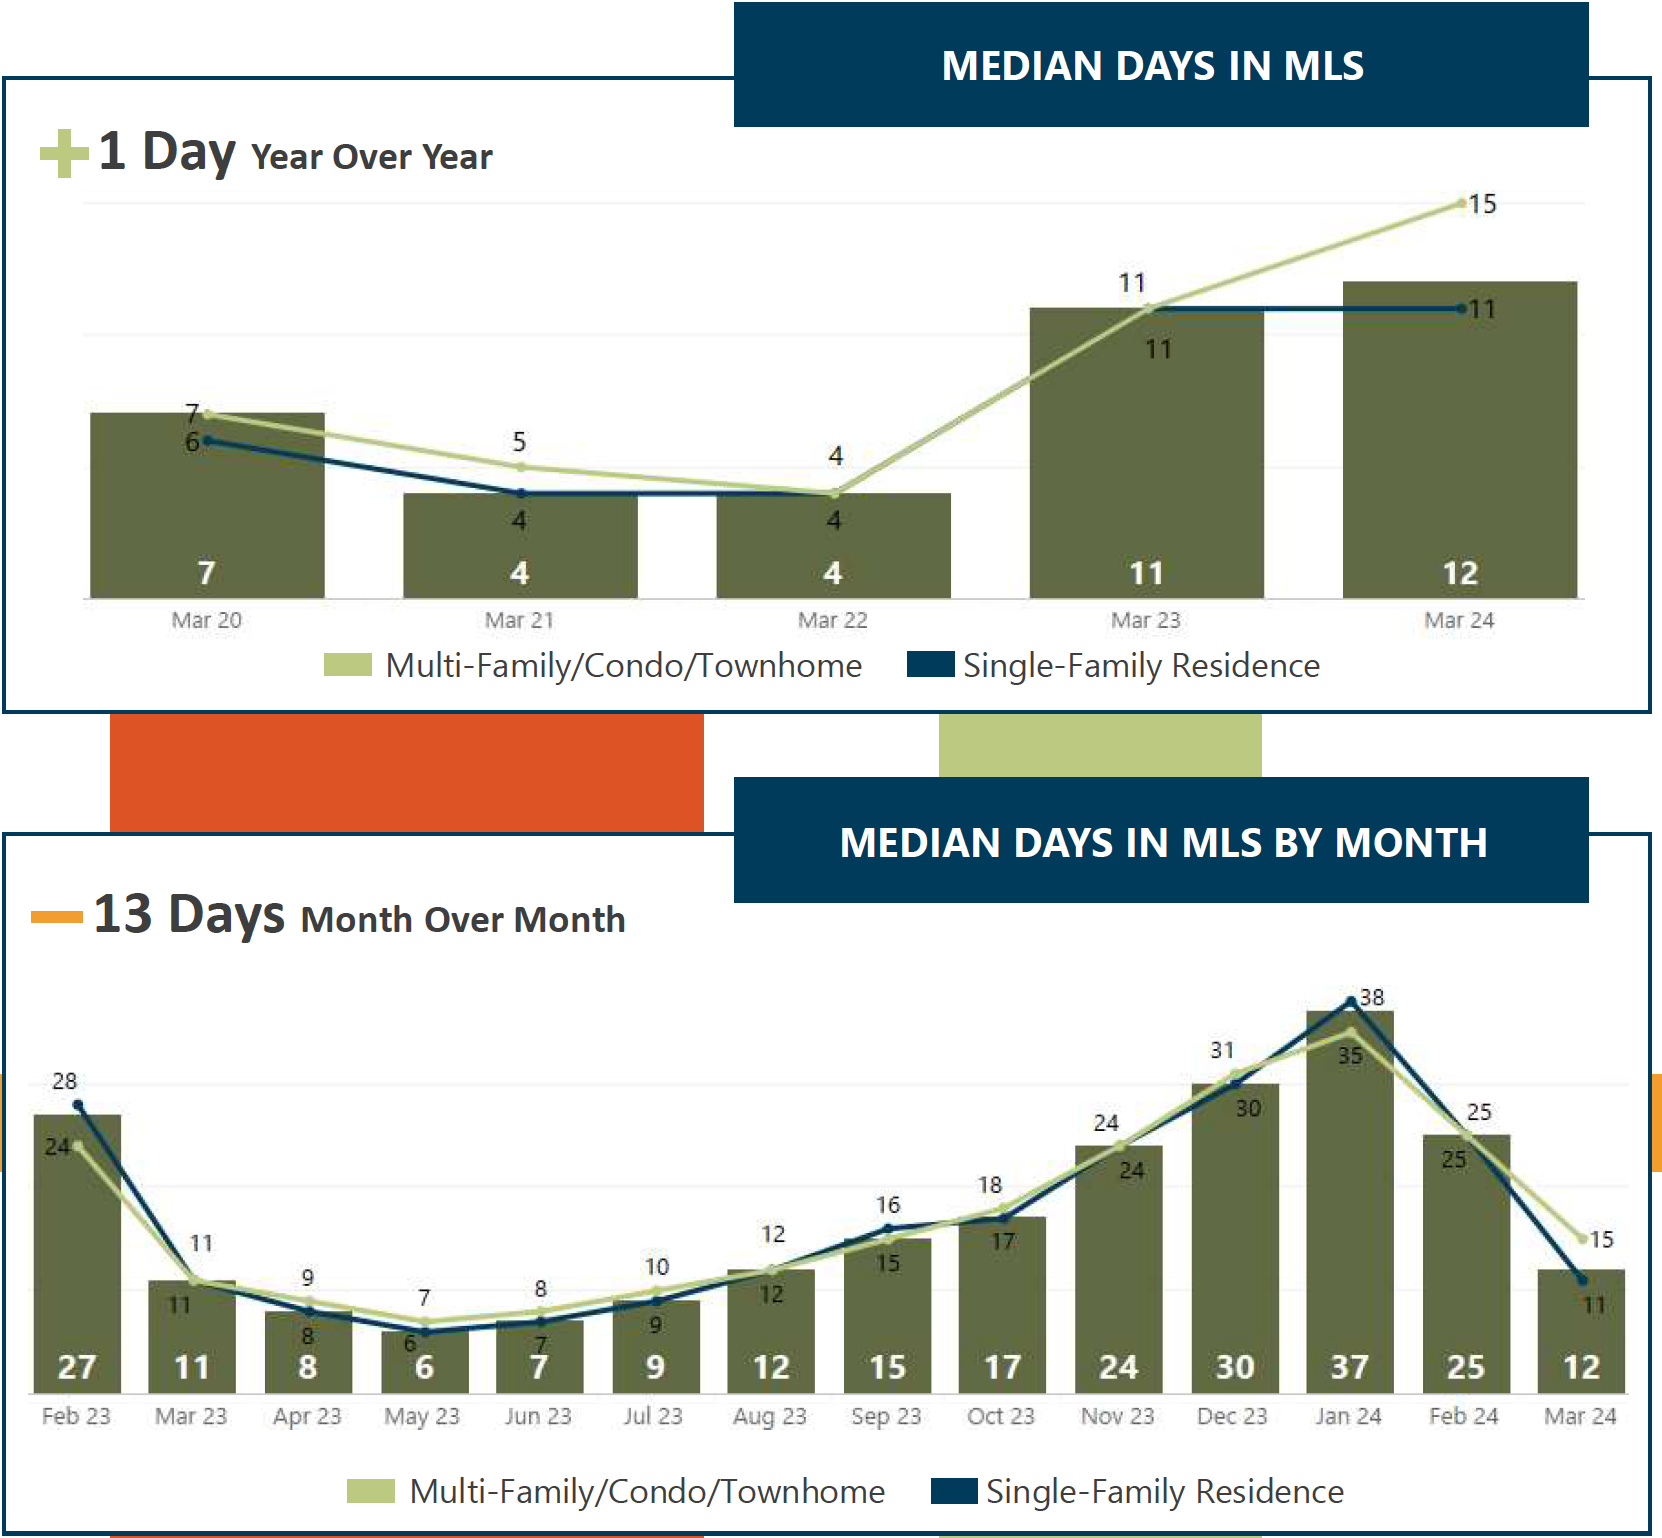
- Homes spent a median of 12 days on the market before going under contract.
- Home closings increased for the third month in a row. 3,570 homes closed in the month of March. The closing prices were 3% higher then last month and 5% higher than last year at this time.
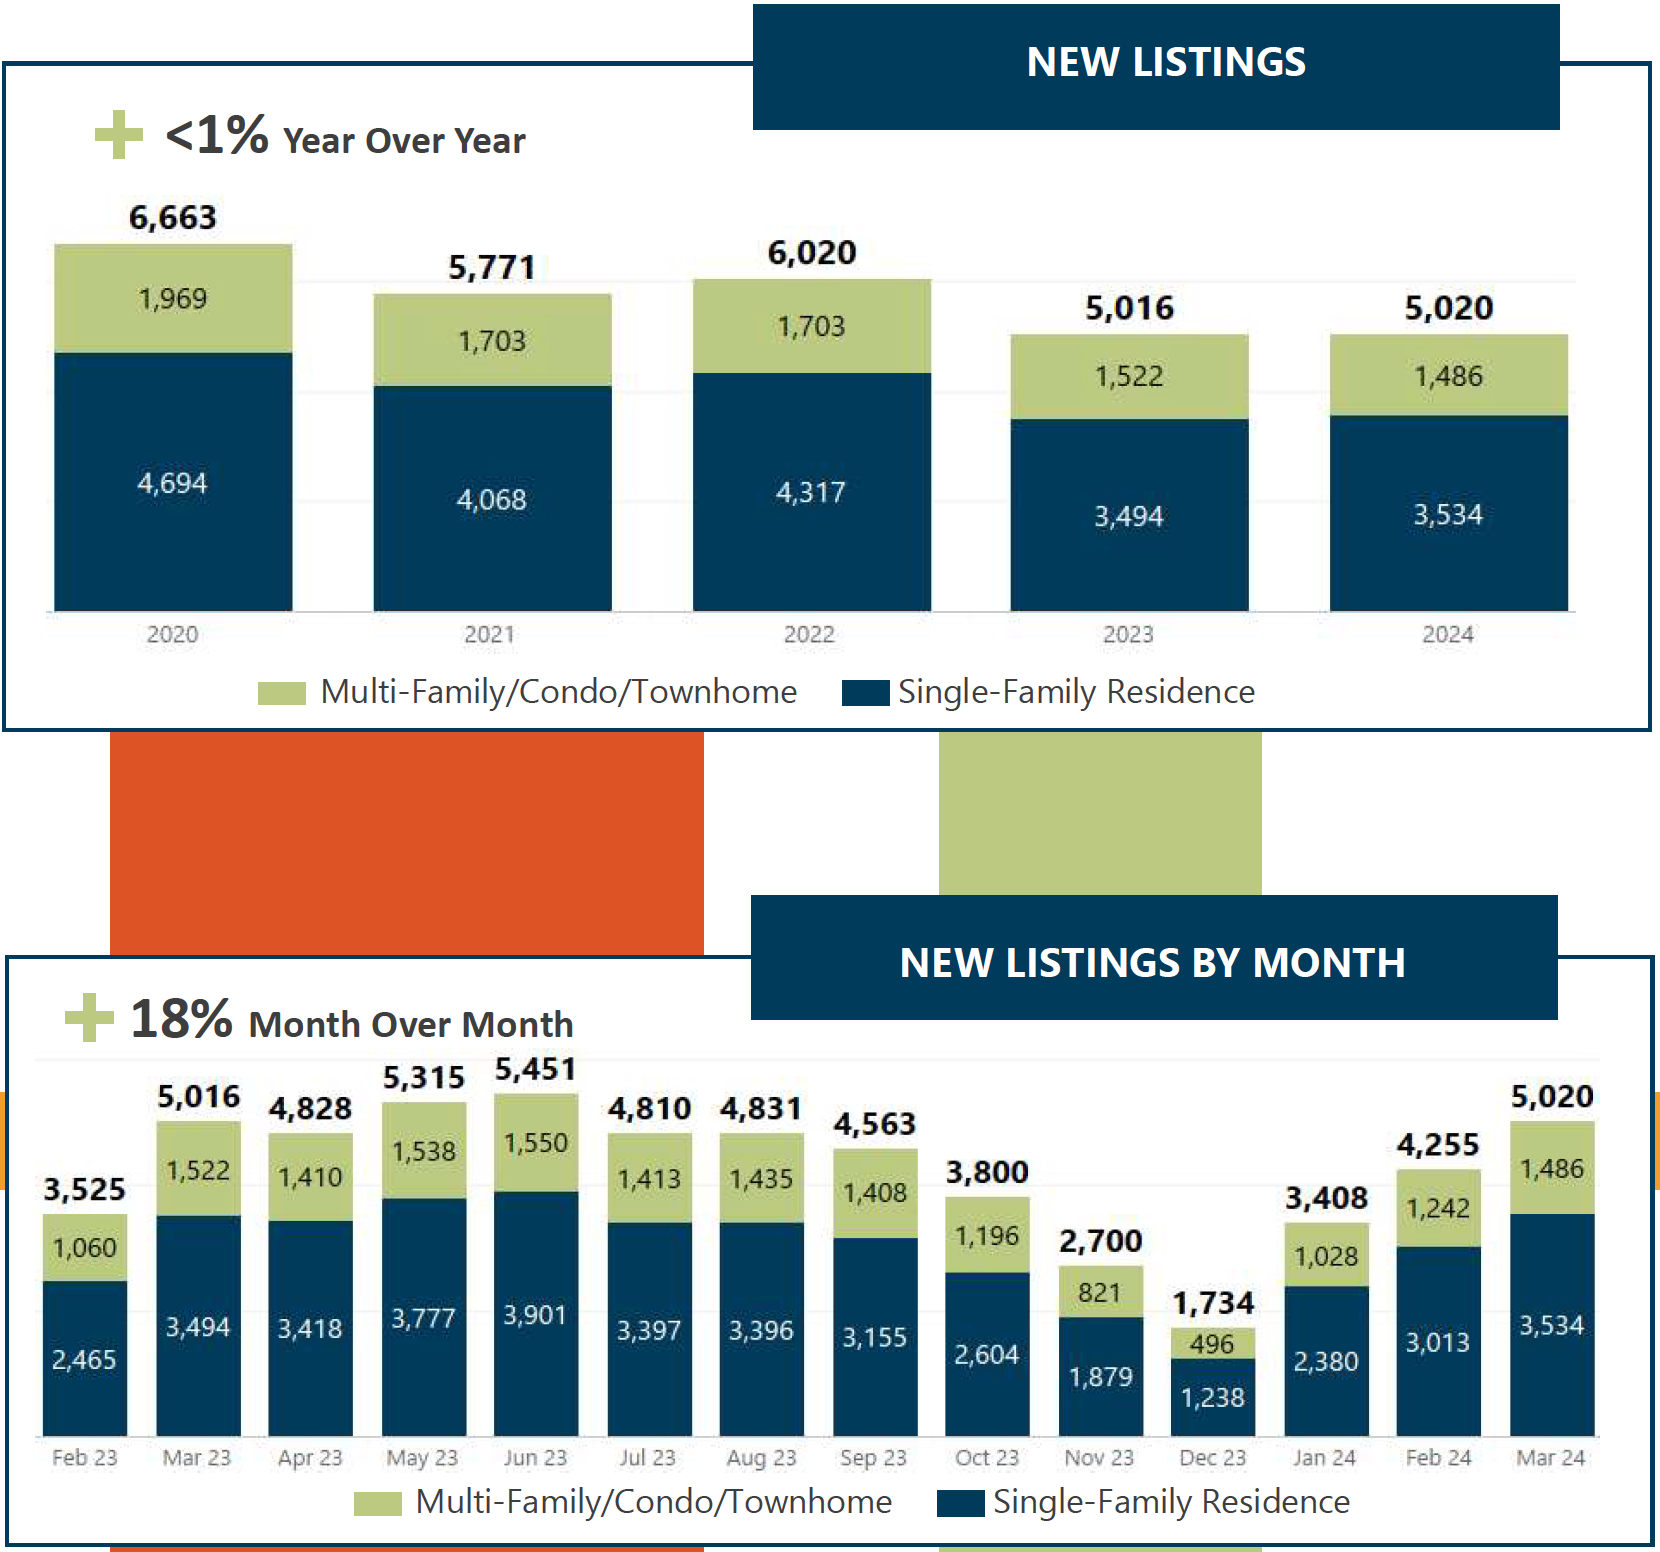
- In March, 5,020 fresh listings were added to the MLS, just slightly more than last year and 18% more than last month.
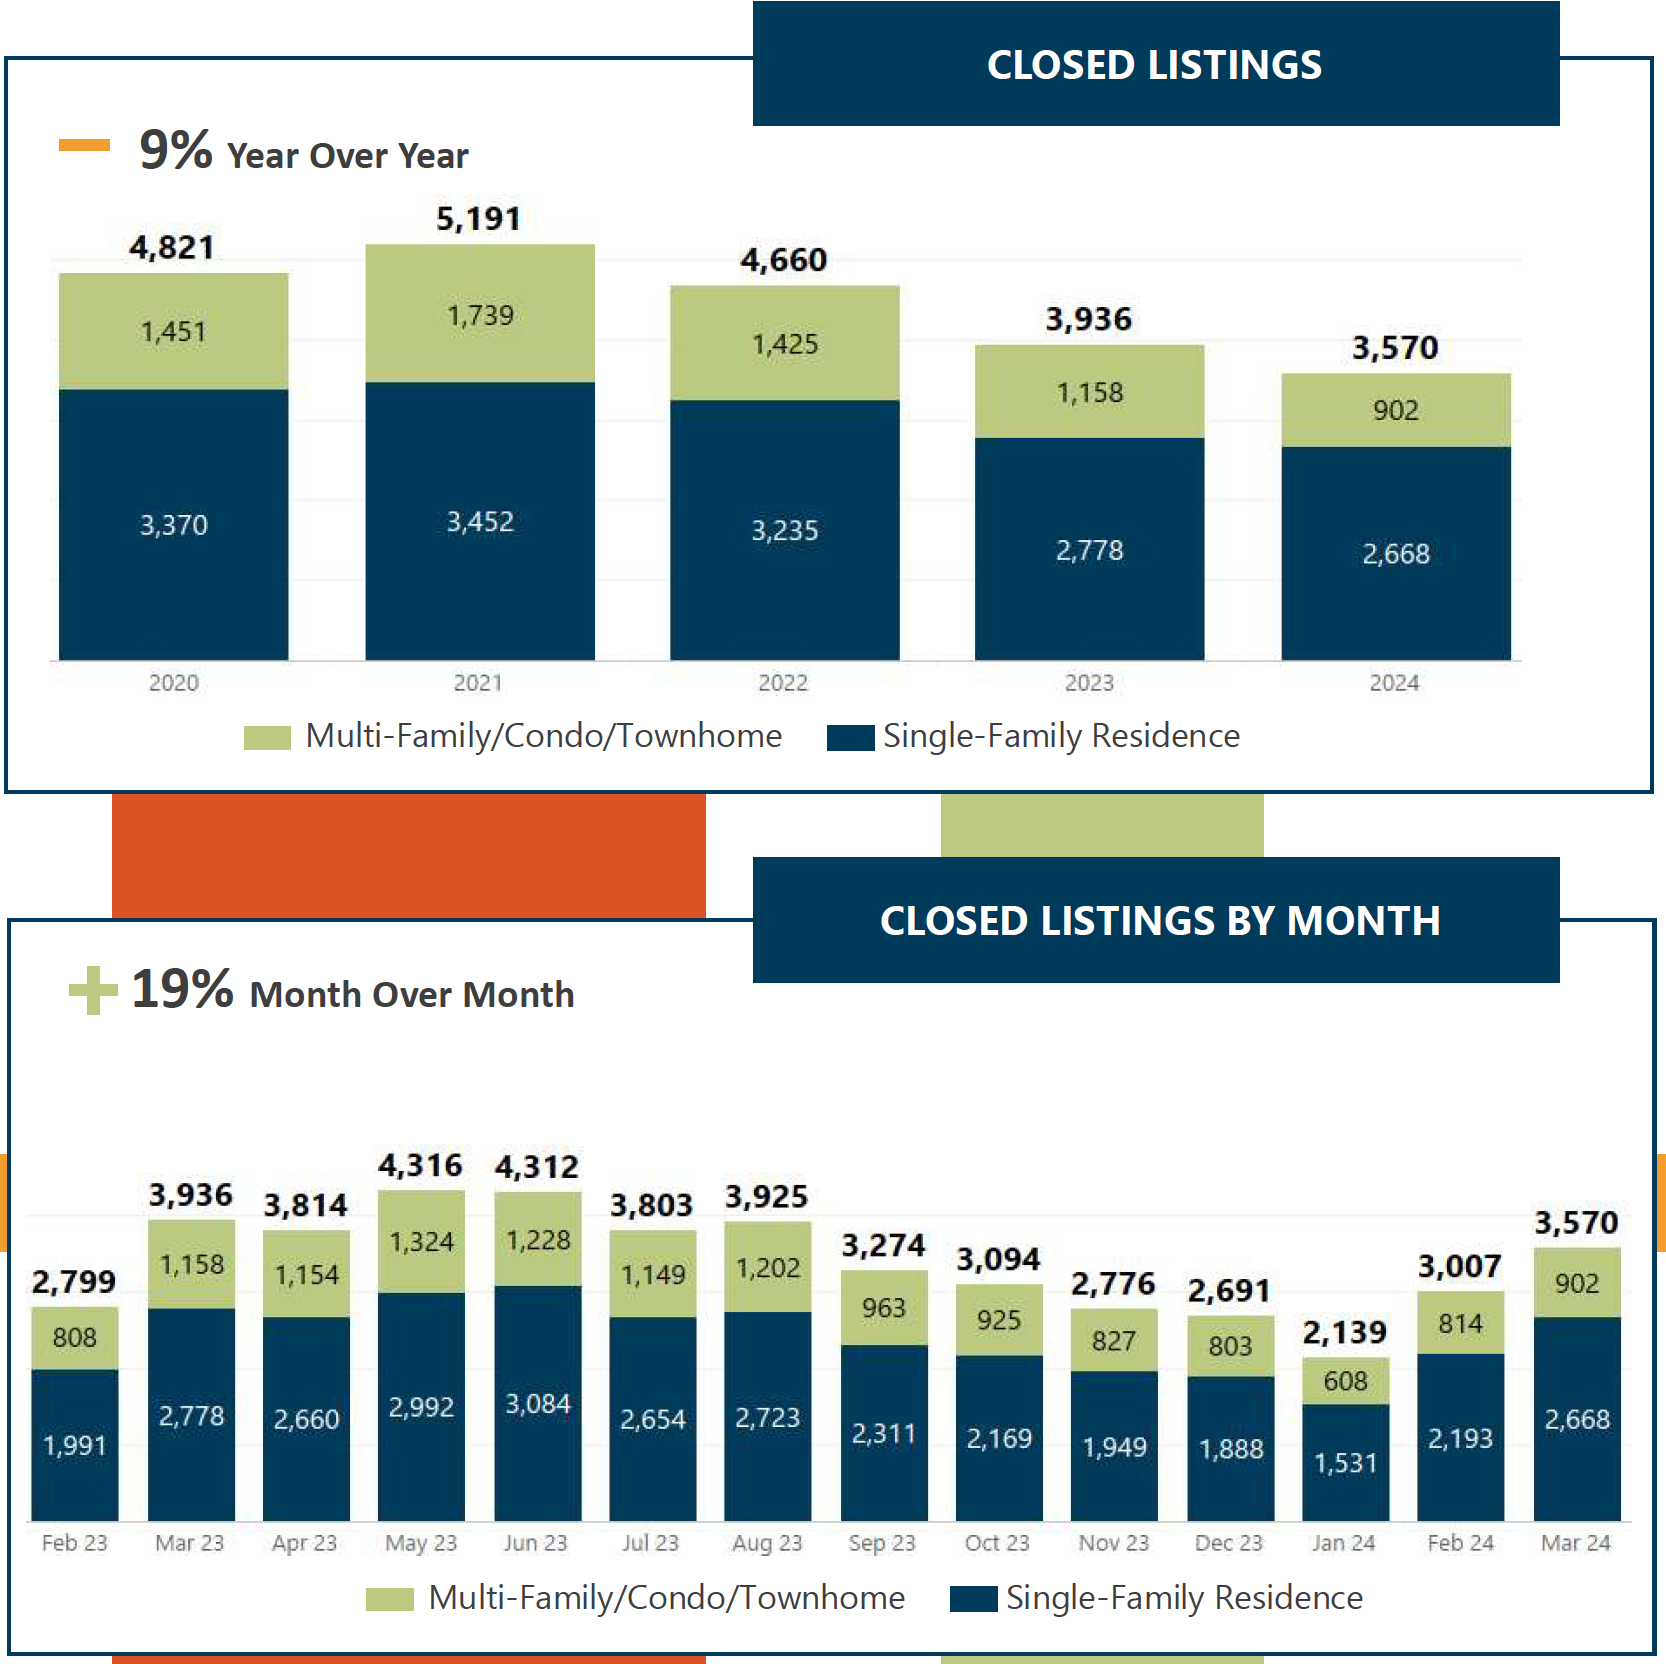
Closed Listings
- Closed listings in March increased by 19% from last month but are still down by 9% from last year at this time.
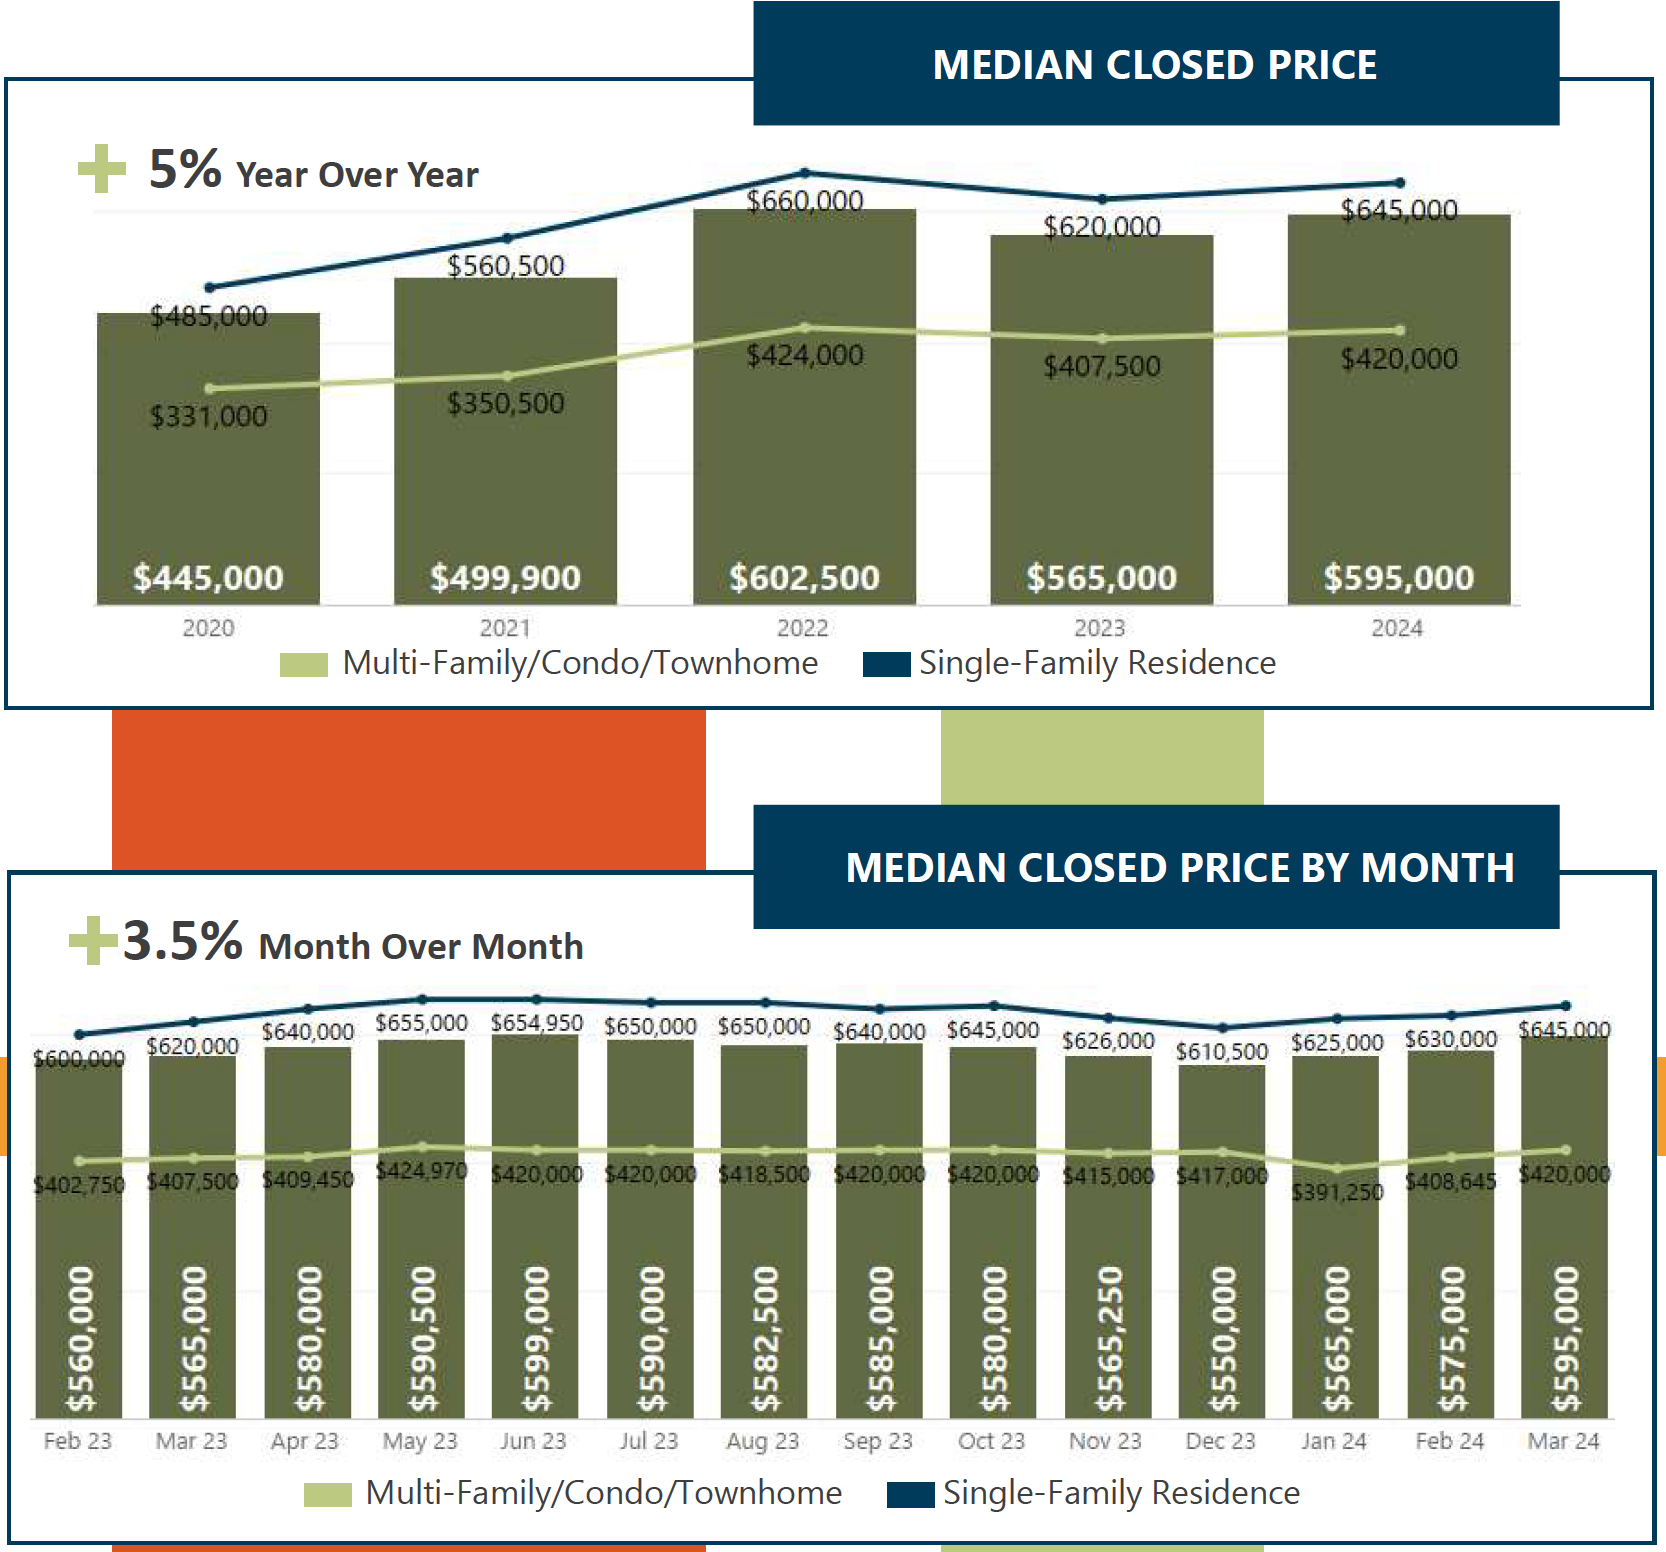
Closed Prices
- The median closed price for a home in the month of March was around $595,000, which is 5% higher than last year at this time. Prices rose about 3% from February to March.
Days in MLS
- Homes spent a median of 12 days in the MLS before going under contract.
New Listings
- Sellers added 5,020 new listings to the market in March, which is slightly more than last March, but 18% more than last month.
Pending Listings
- Buyers executed 4,343 contracts on homes in March. This was 8% higher than last March and 33% higher than last month!
Activity by Price Range
-
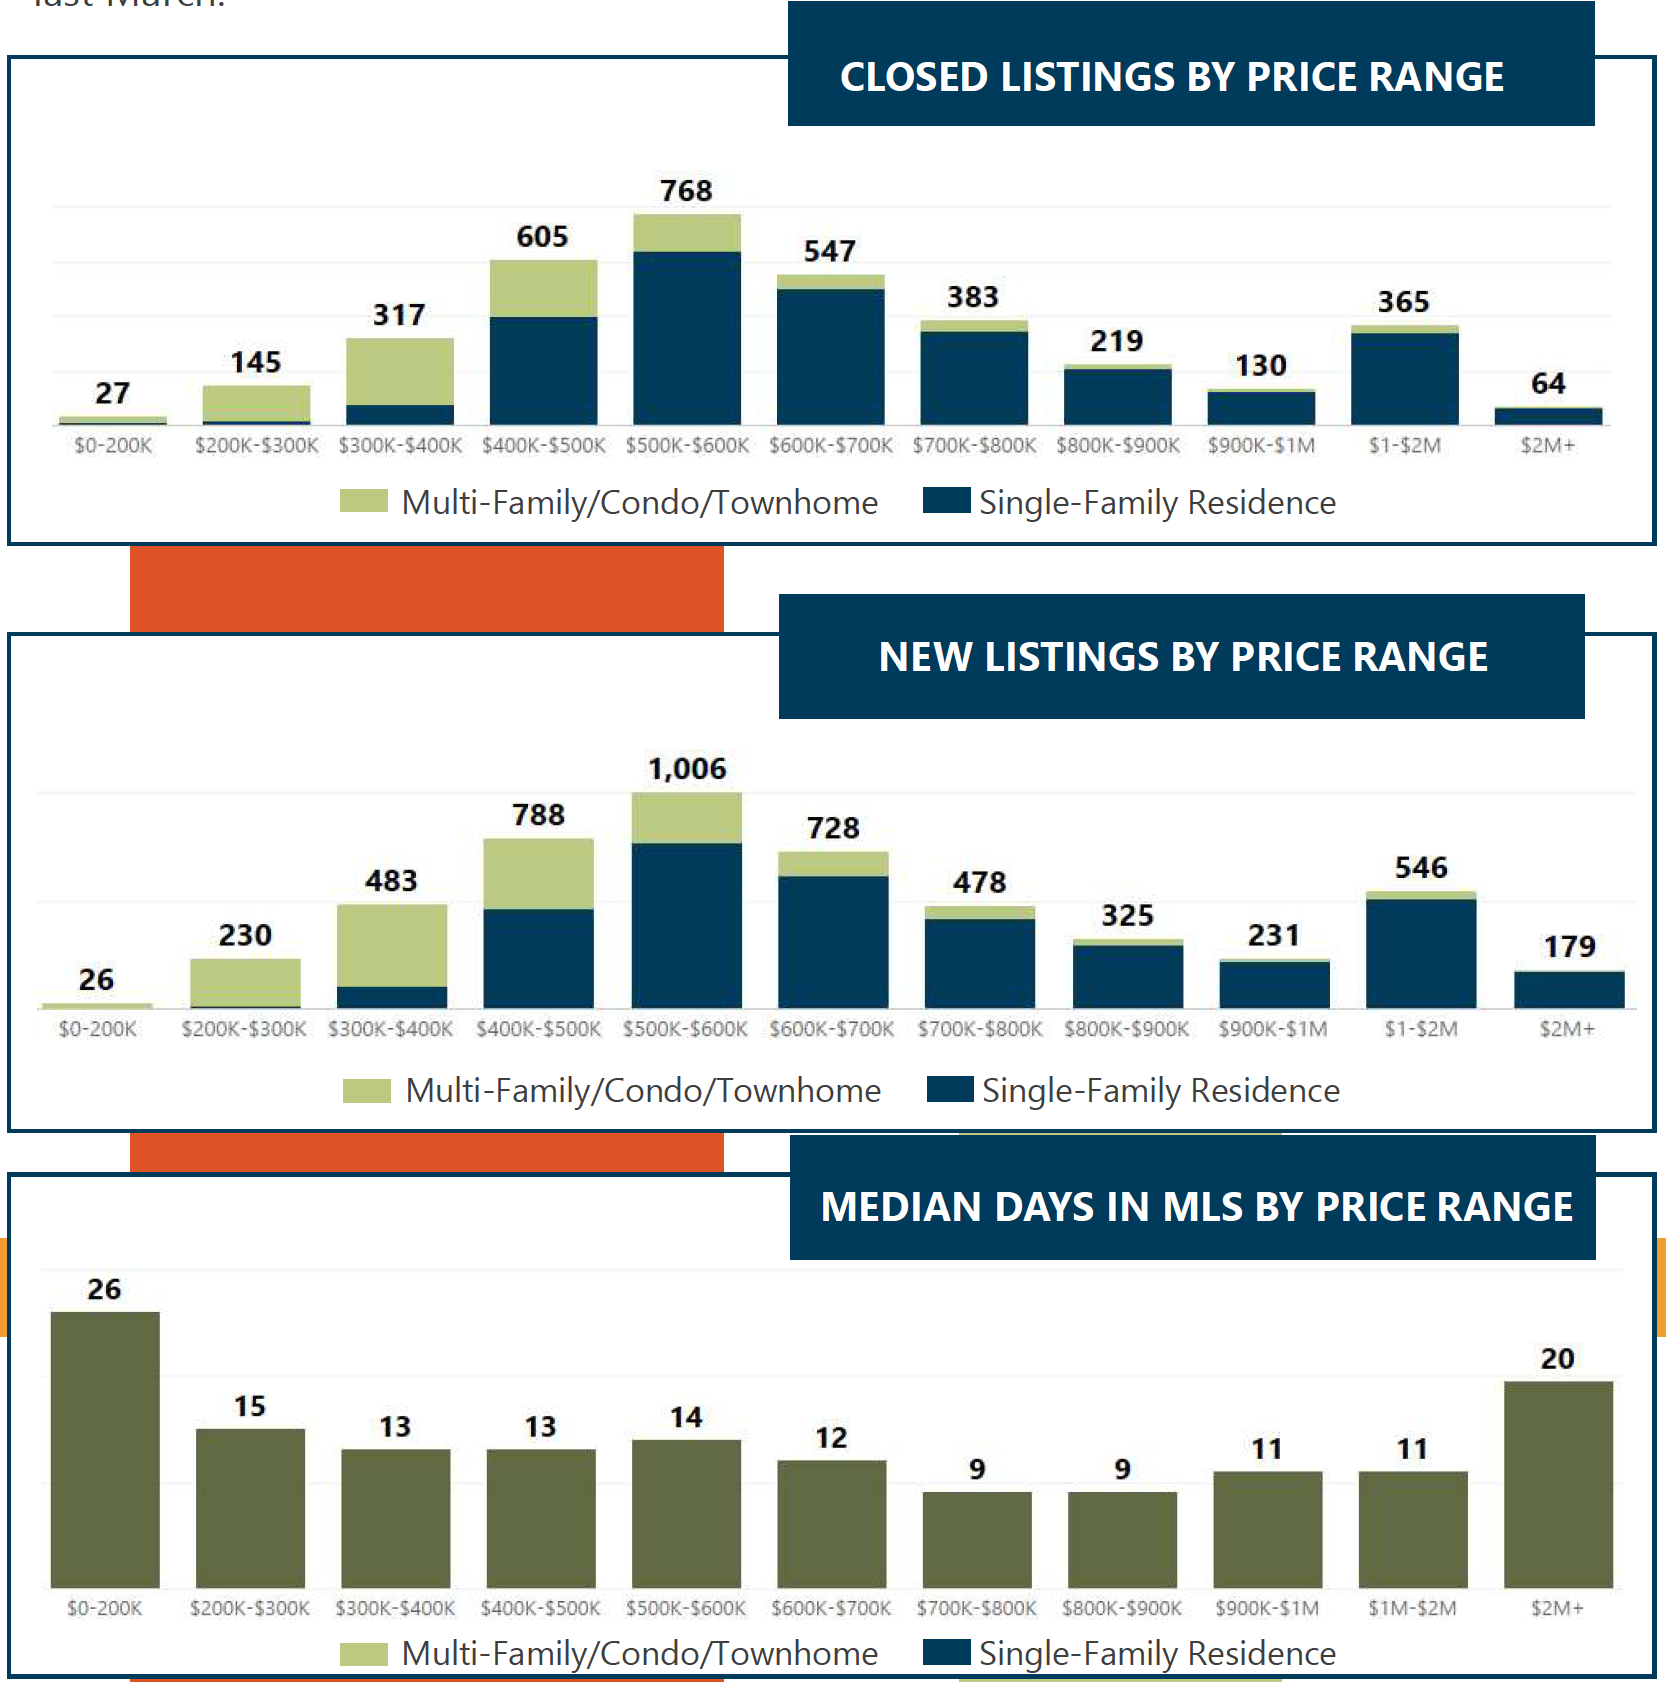
The Home listings priced in the $1 to 2 million range saw market had a strong March. Throughout the month, 365 homes in this price range closed, which is 14% more than last March. Homes priced $1 to 2 million were available in the MLS a median of 11 days. Sellers brought 546 new listings to the market in the $1 to 2 million price range, 7% more than last March.
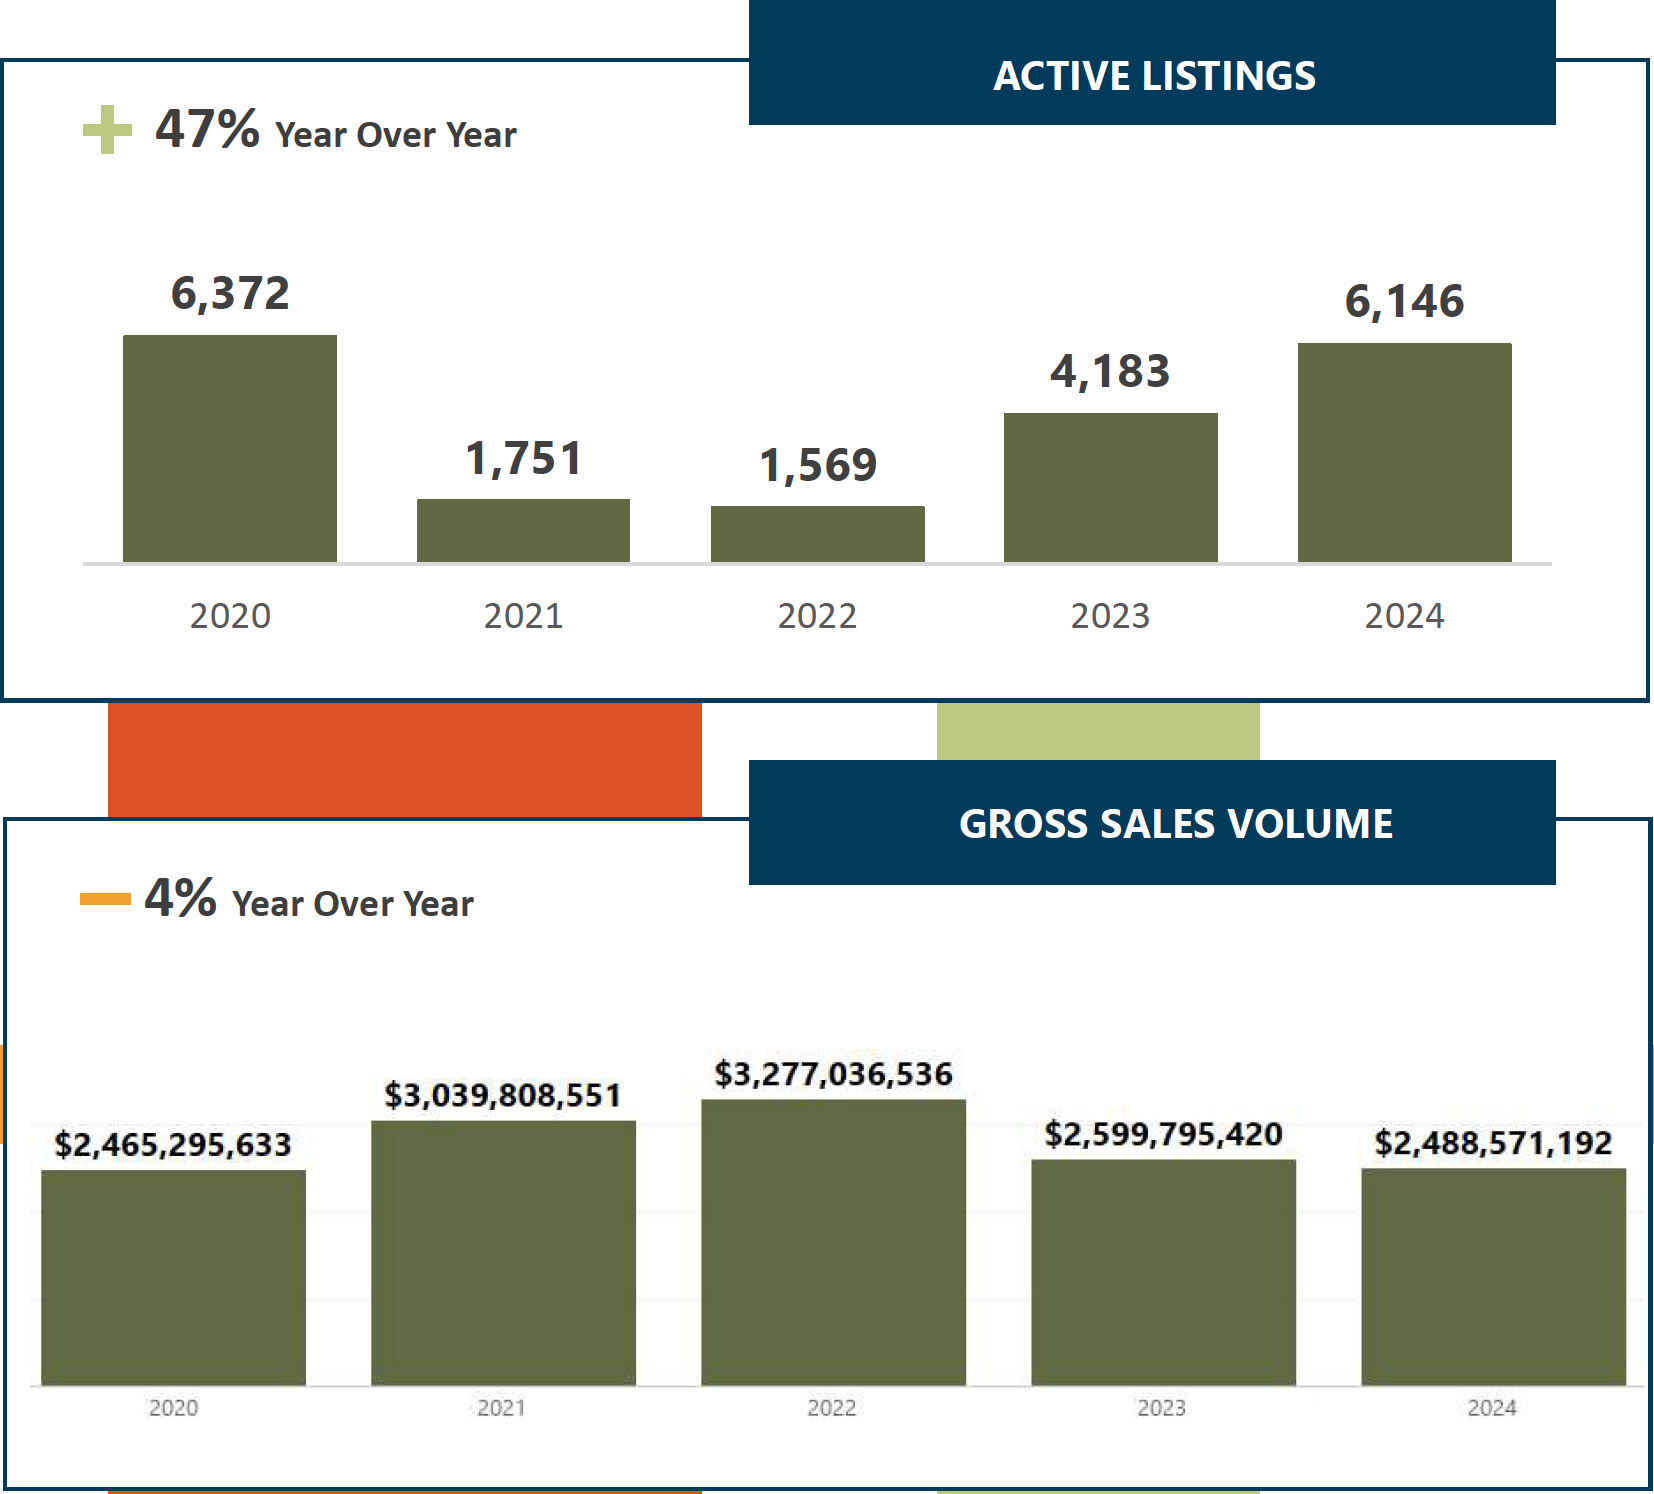
Active Listings and Volume
- Standing inventory was 47% higher than last March, with 6,146 homes actively available in the Denver metro area. The gross sales volume in March was 4% lower than last March.