Highlights
January 2023
-
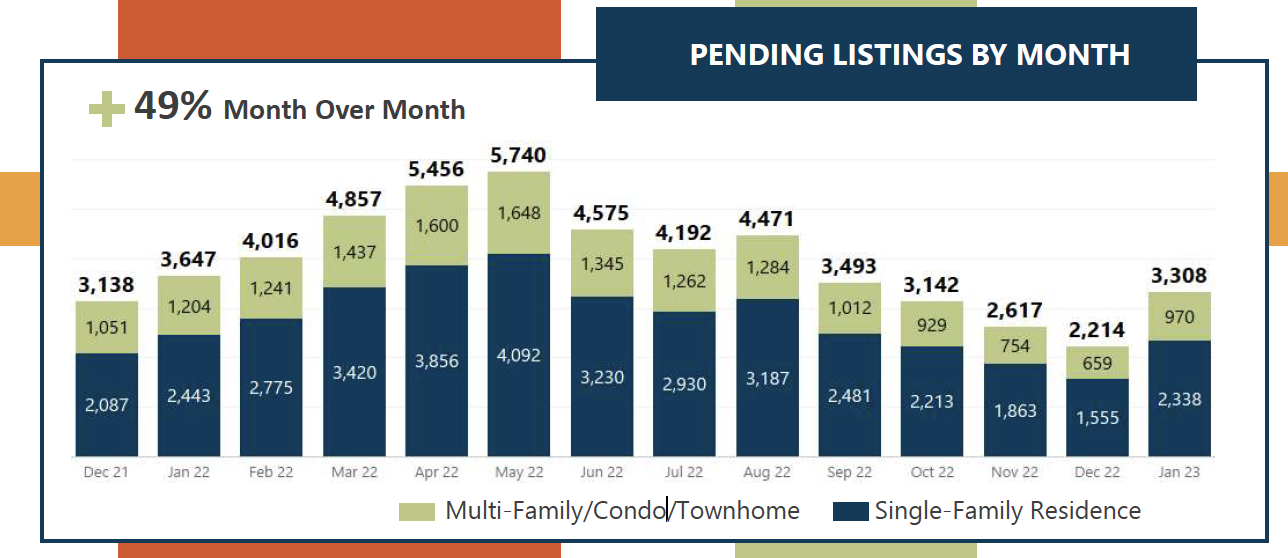
Denver Metro housing market experienced a strong start to the year. There was an uptick in both buyer and seller activity. The number of listings that moved from Active to Pending status increased nearly 50% from December, indicating increased closings in the upcoming months. closings will follow in the upcoming months.
-
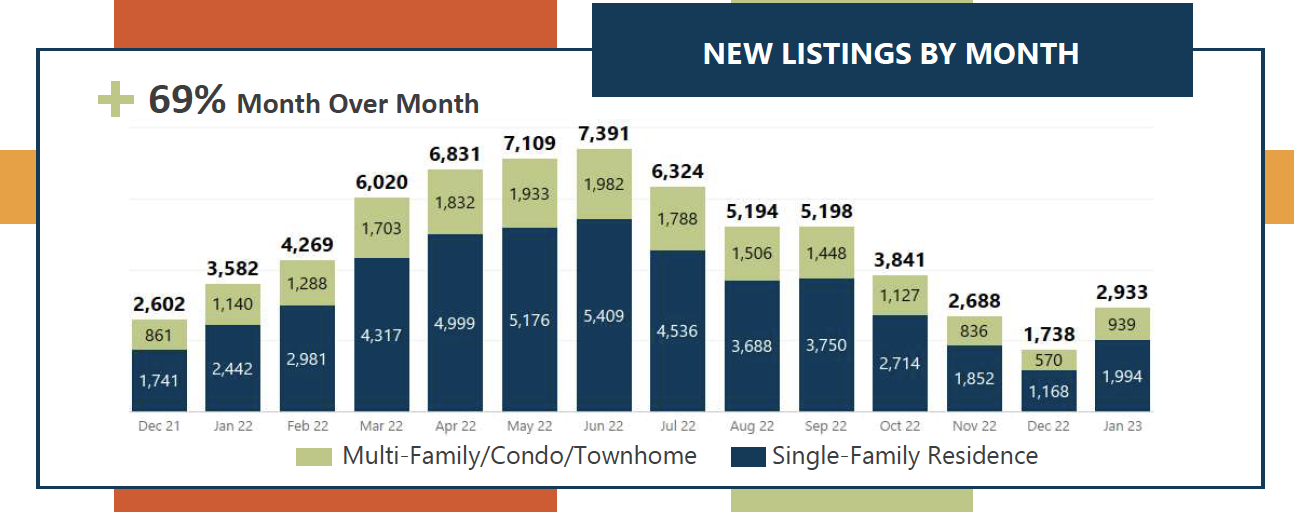
Although sellers brought 69% more New Listings to the market than we saw in December, inventory levels remain low, especially in the more affordable price ranges. High prices and mortgage rates give prospective sellers little incentive to list their homes.
-
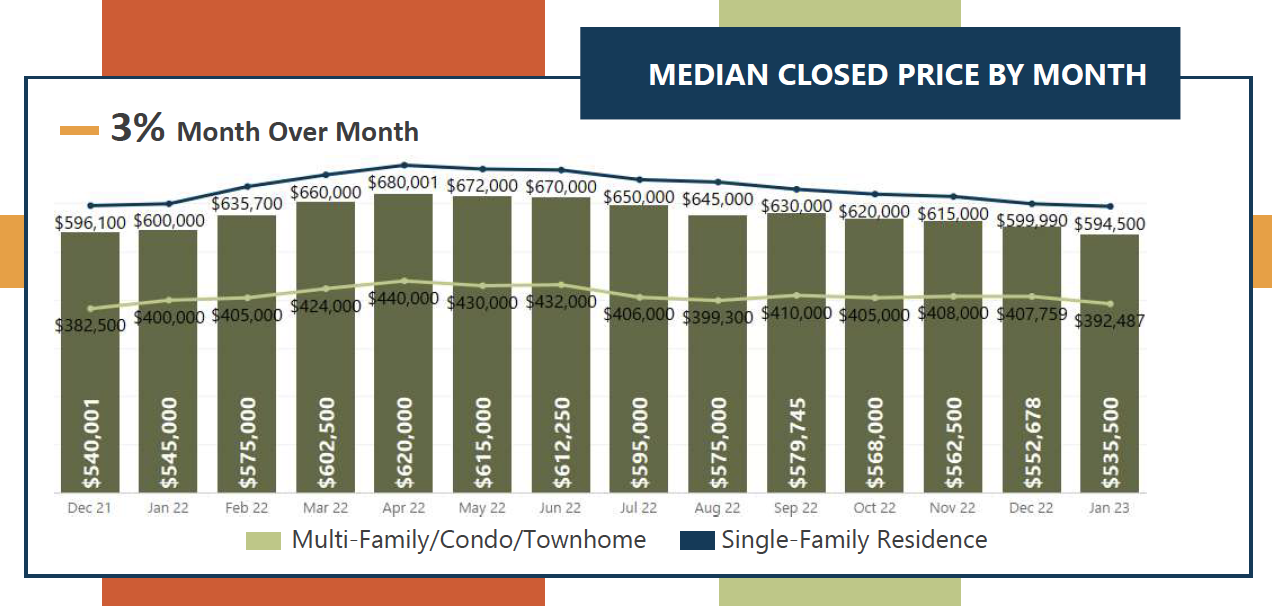
Median Closed prices have been declining steadily following their peak in the spring of 2022. They dipped again in January and are now 14% lower than the 2021 peak. Home prices are staying in check as buyers exercise their negotiating power. In January, the median closed price was 4% lower than the median list price.
-
More and more Colorado brokers are entering their listings in REcolorado, giving us the chance to produce rental market statistics. The rental market saw year-over-year gains in terms of the number of properties leased and median leased price.
Closed Listings
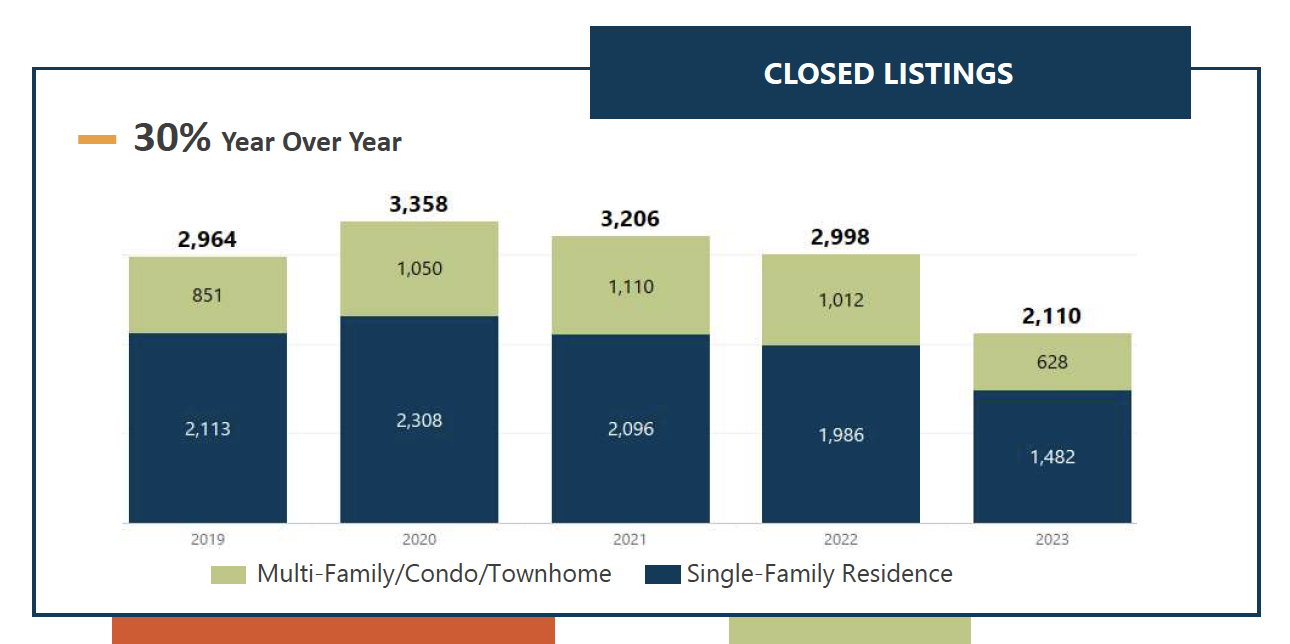
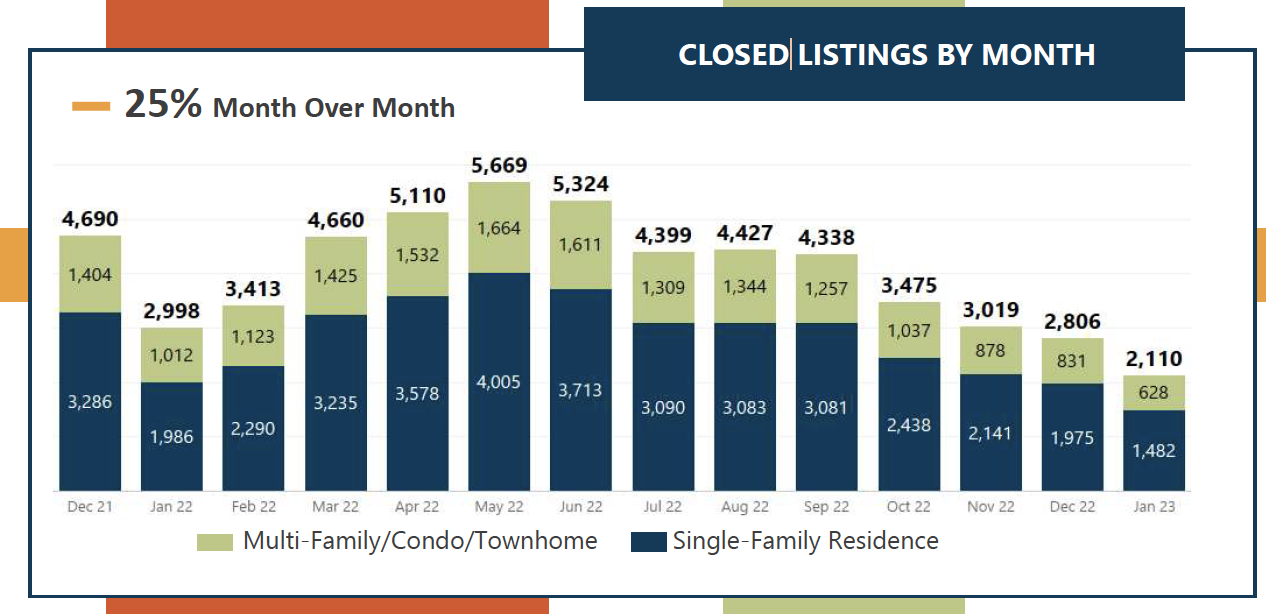
Home shopping activity dipped to record-low levels in November and December. As a result, home closings in the Denver Metro area were 30% lower than January 2022 and 25% lower than last month.
Pending Listings
Home shopping activity picked up in January sending the number of listings pending sale 49% higher than we saw in December. Still, the number of Pending Listings is lower than we’ve seen in any January since 2012.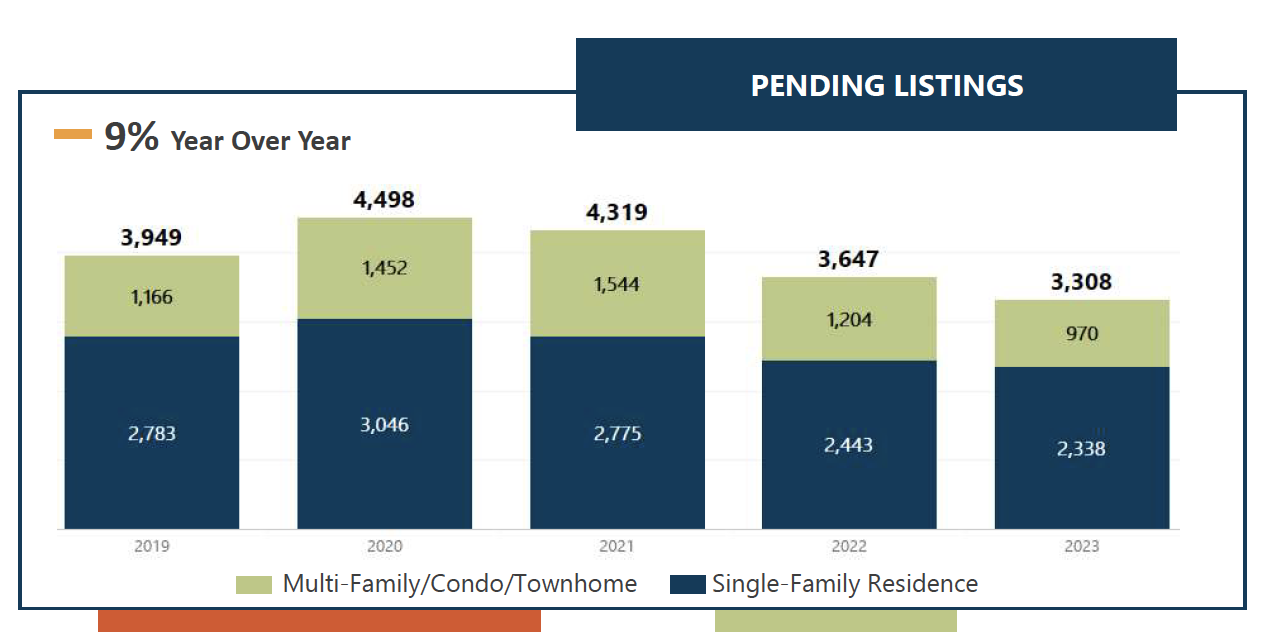
Closed Prices
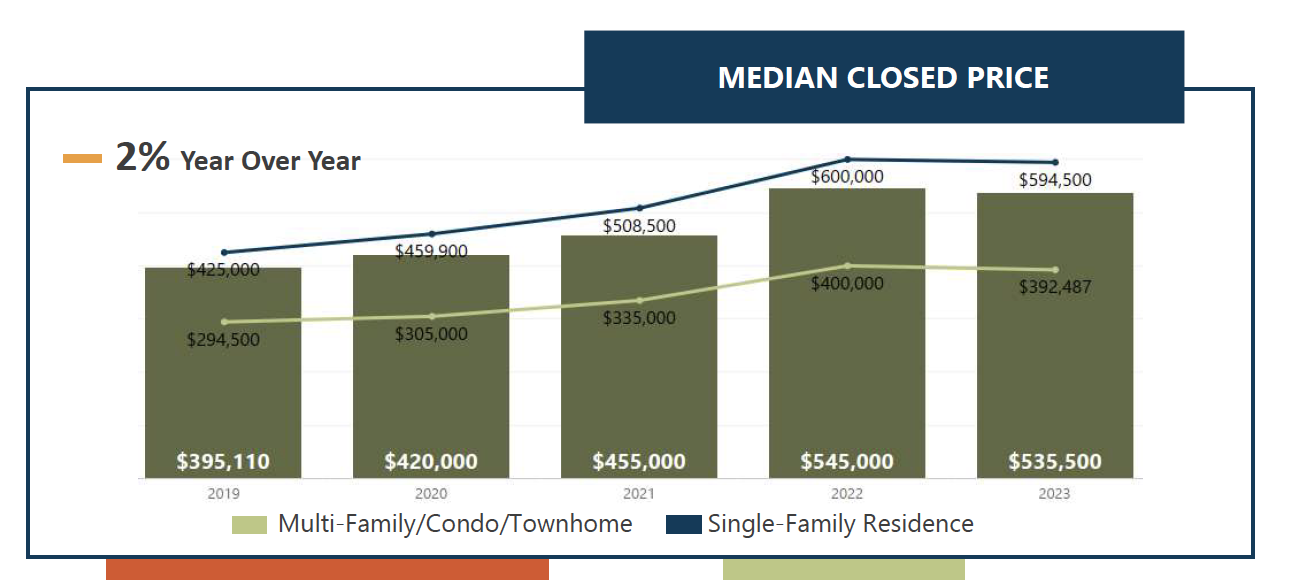
Median Closed prices have been declining steadily following their peak in the spring of 2022. They dipped again in January and are now 14% lower than the 2021 peak. Home prices are staying in check as buyers exercise their negotiating power. In January, the median closed price was 4% lower than the median list price.
New Listings
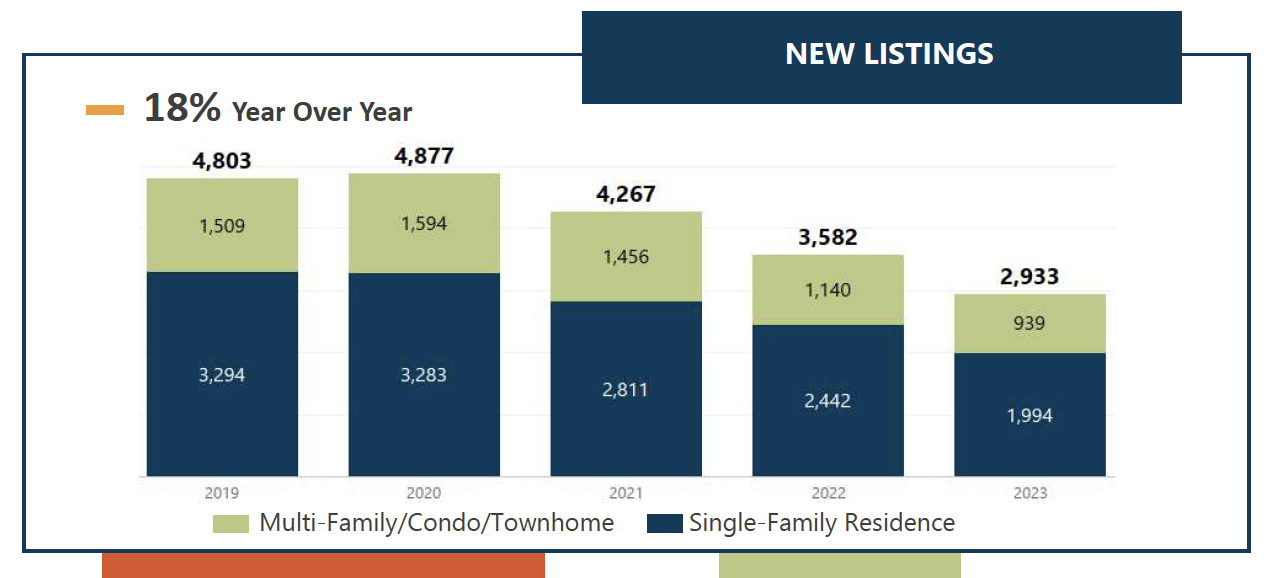
January brought a welcome month-over-month increase in the number of fresh listings sellers brought to the market. Still, the metric for New Listings is 18% lower than last year and lower than any January on record. Inventory will remain a challenge as homeowners choose to remain in their homes.
Days In MLS
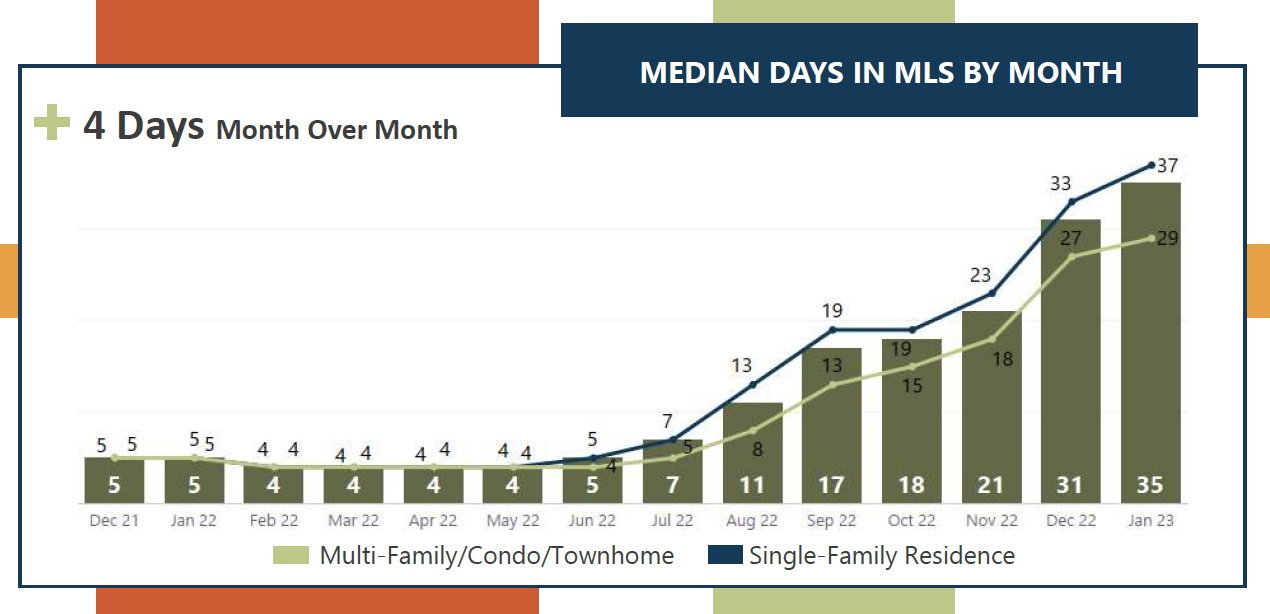
The metric for Days in MLS, which is the number of days it takes a listing to go from Active to Pending, shows home shoppers are taking their time to make home-buying decisions. In January, shoppers took a median of 5 weeks to execute a contract on a home.
Activity by Price Range
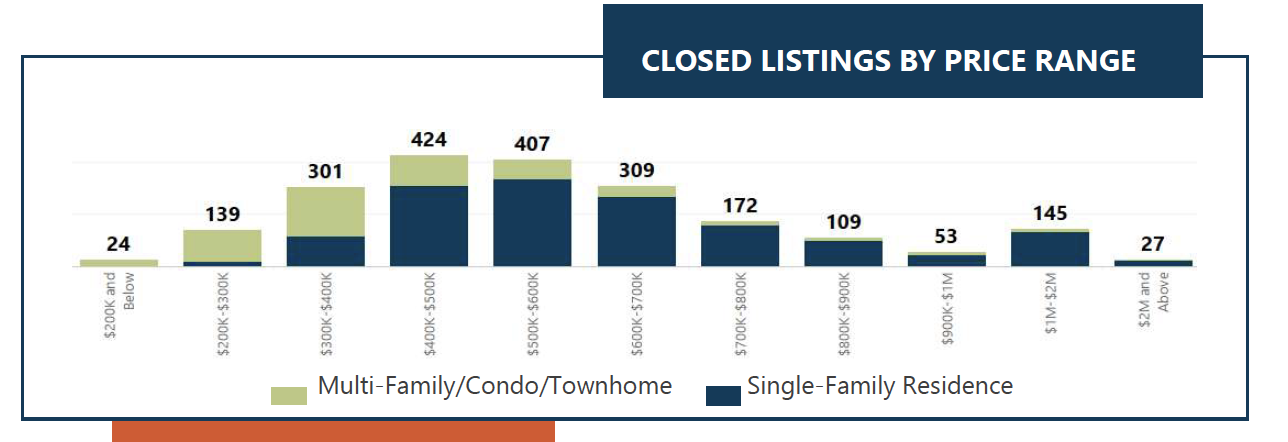
In January, the majority of homes that closed and new listings of homes for sale were priced in the $400-500,000 and $500-600,000 price ranges. Demand and new listings continue to increase in the ranges $1M and higher. The median number of days a property was actively available in the MLS has increased across all price ranges. More moderately priced homes are moving off the market at a faster rate.
Active Listings and Volume
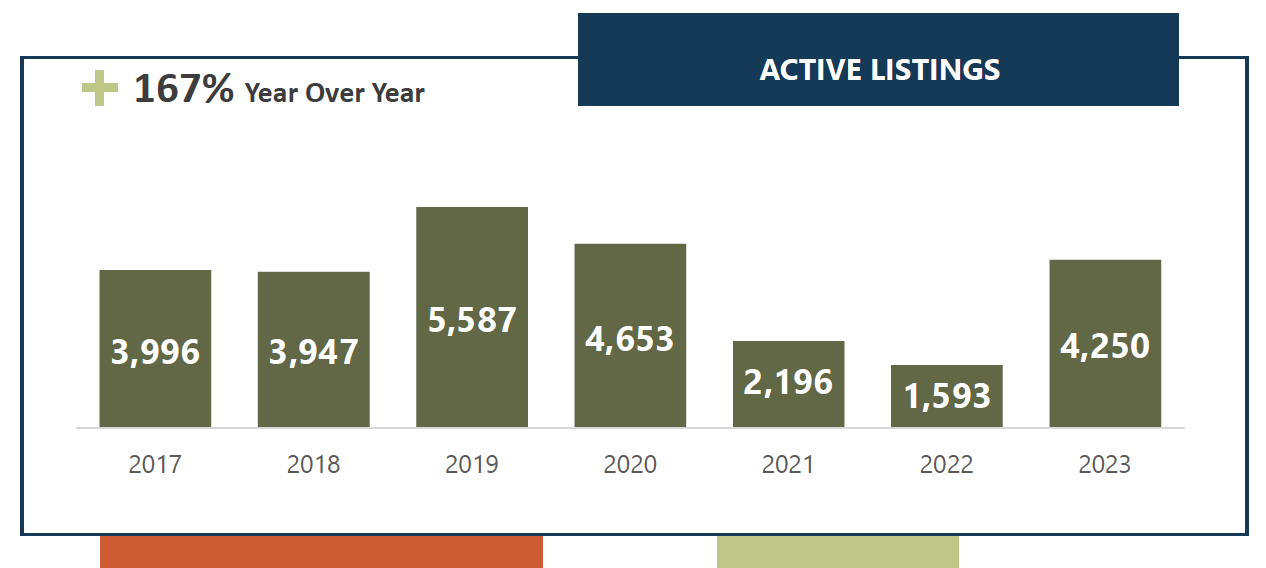
Standing inventory, or the number of home listings actively available for sale at the end of the month, returned to pre-pandemic levels in January. Buyers have more inventory to consider and are taking their time to execute offers.
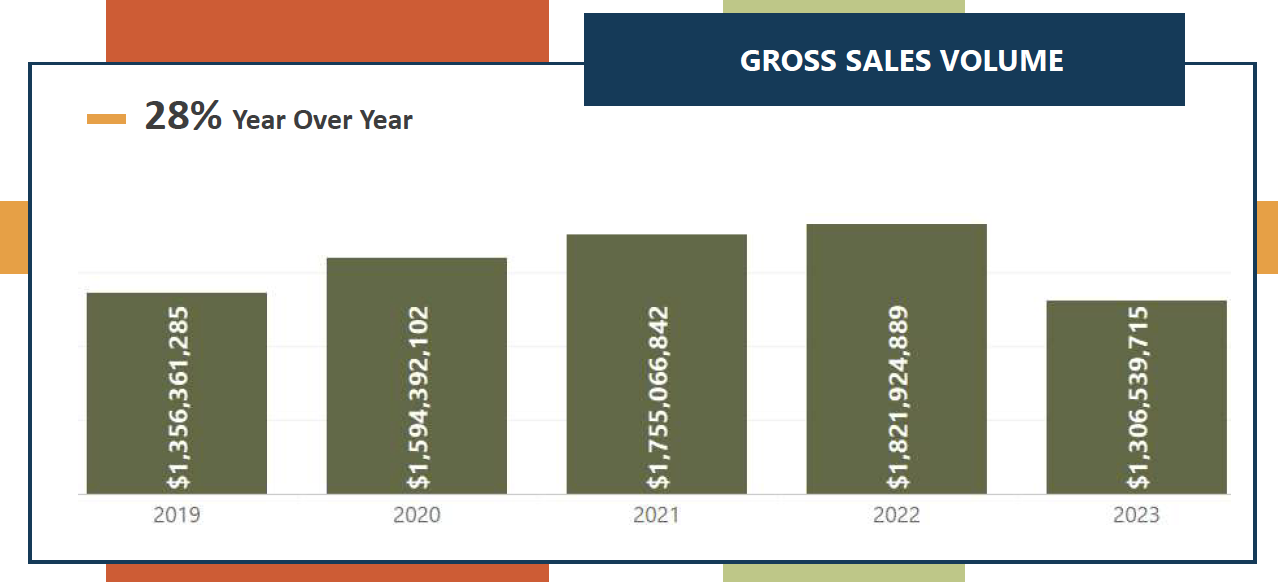
The gross volume of sales in January totaled more than $1.3 billion, which is 28% lower than last year due to a decrease in the number of closings.


