The Denver 100 provides this Annual Real Estate Report as a service to our clientele and friends to give the current trends in the Denver residential real estate market and a resource to predict the future housing direction in our marketplace. In this post, you can find historical data from the 2022 Denver real estate market, along with our predictions for 2023 real estate trends. We pride ourselves on being better informed real estate brokers, and we thank you for your past support and future opportunities to serve your real estate needs.
Greater Denver Metro Area Communities
Arapahoe, Adams, Boulder, Broomfield, Denver, Douglas, Elbert, and Jefferson
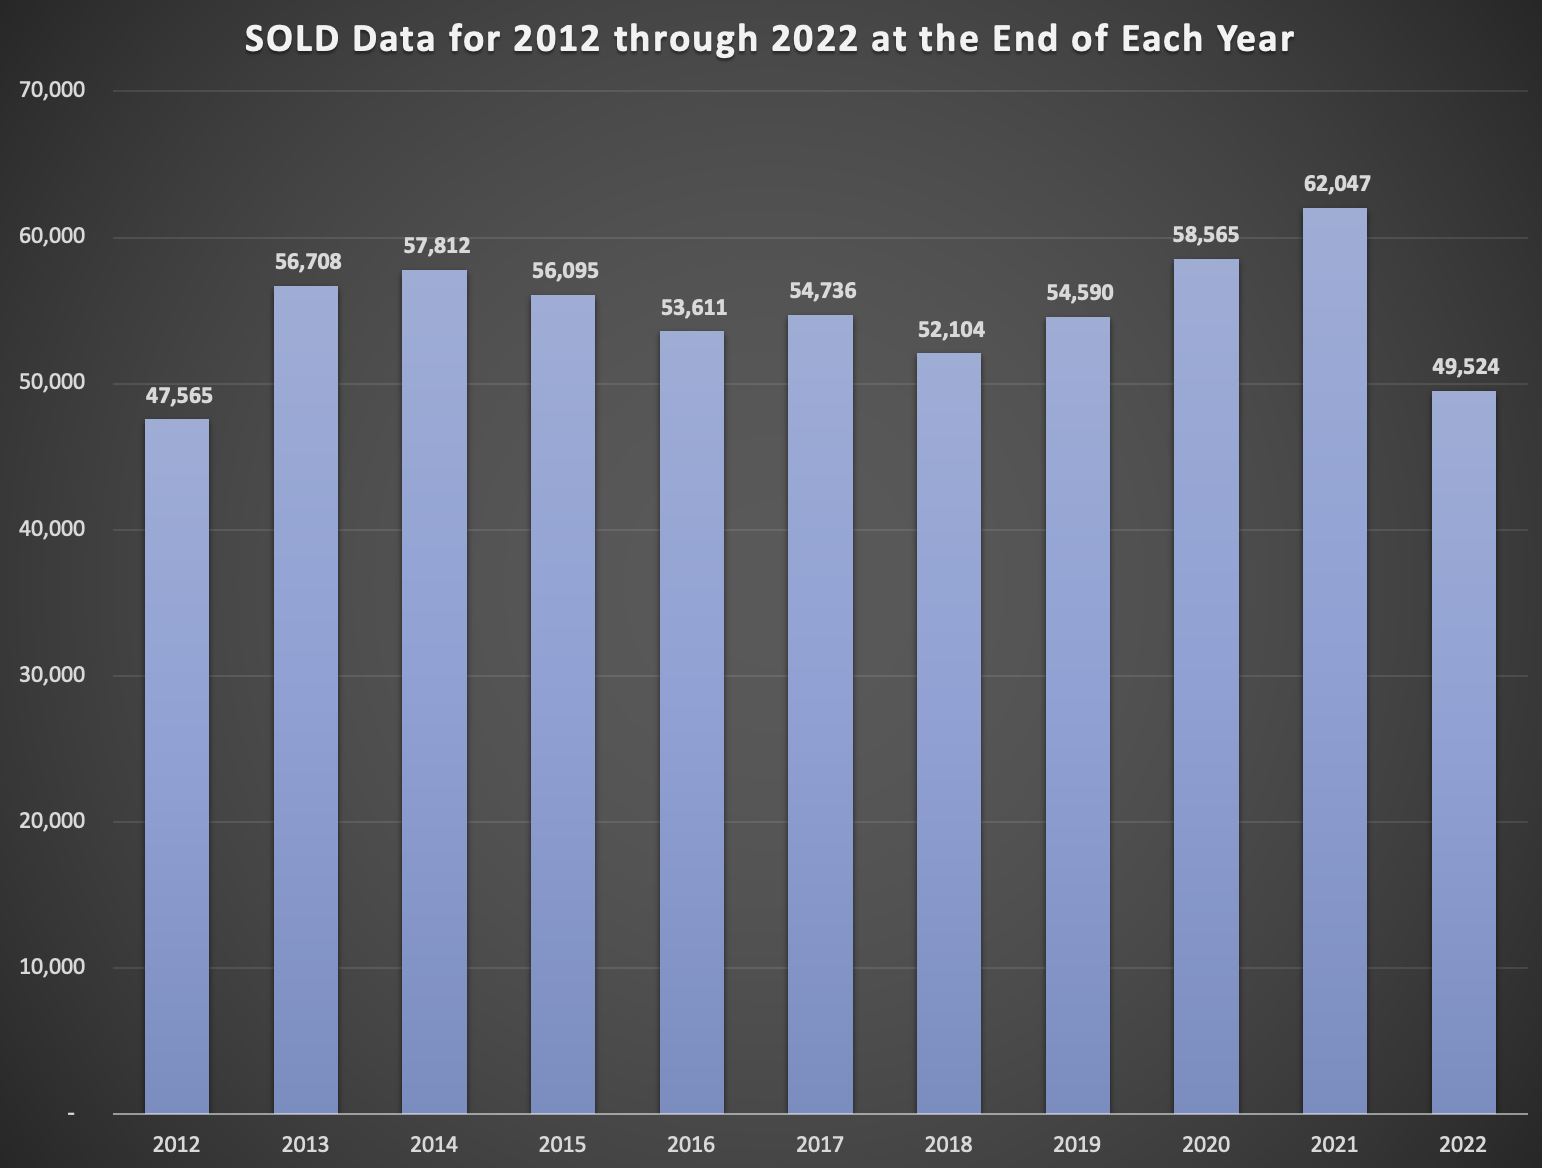
49,524 single family and condominiums sold in 2022 compared to 62,047 that sold in 2021 or a 20.2% decrease in the number of homes closed year over year. This was a significant change, especially since the first 5 months of 2022, experienced record sales above the previous year.
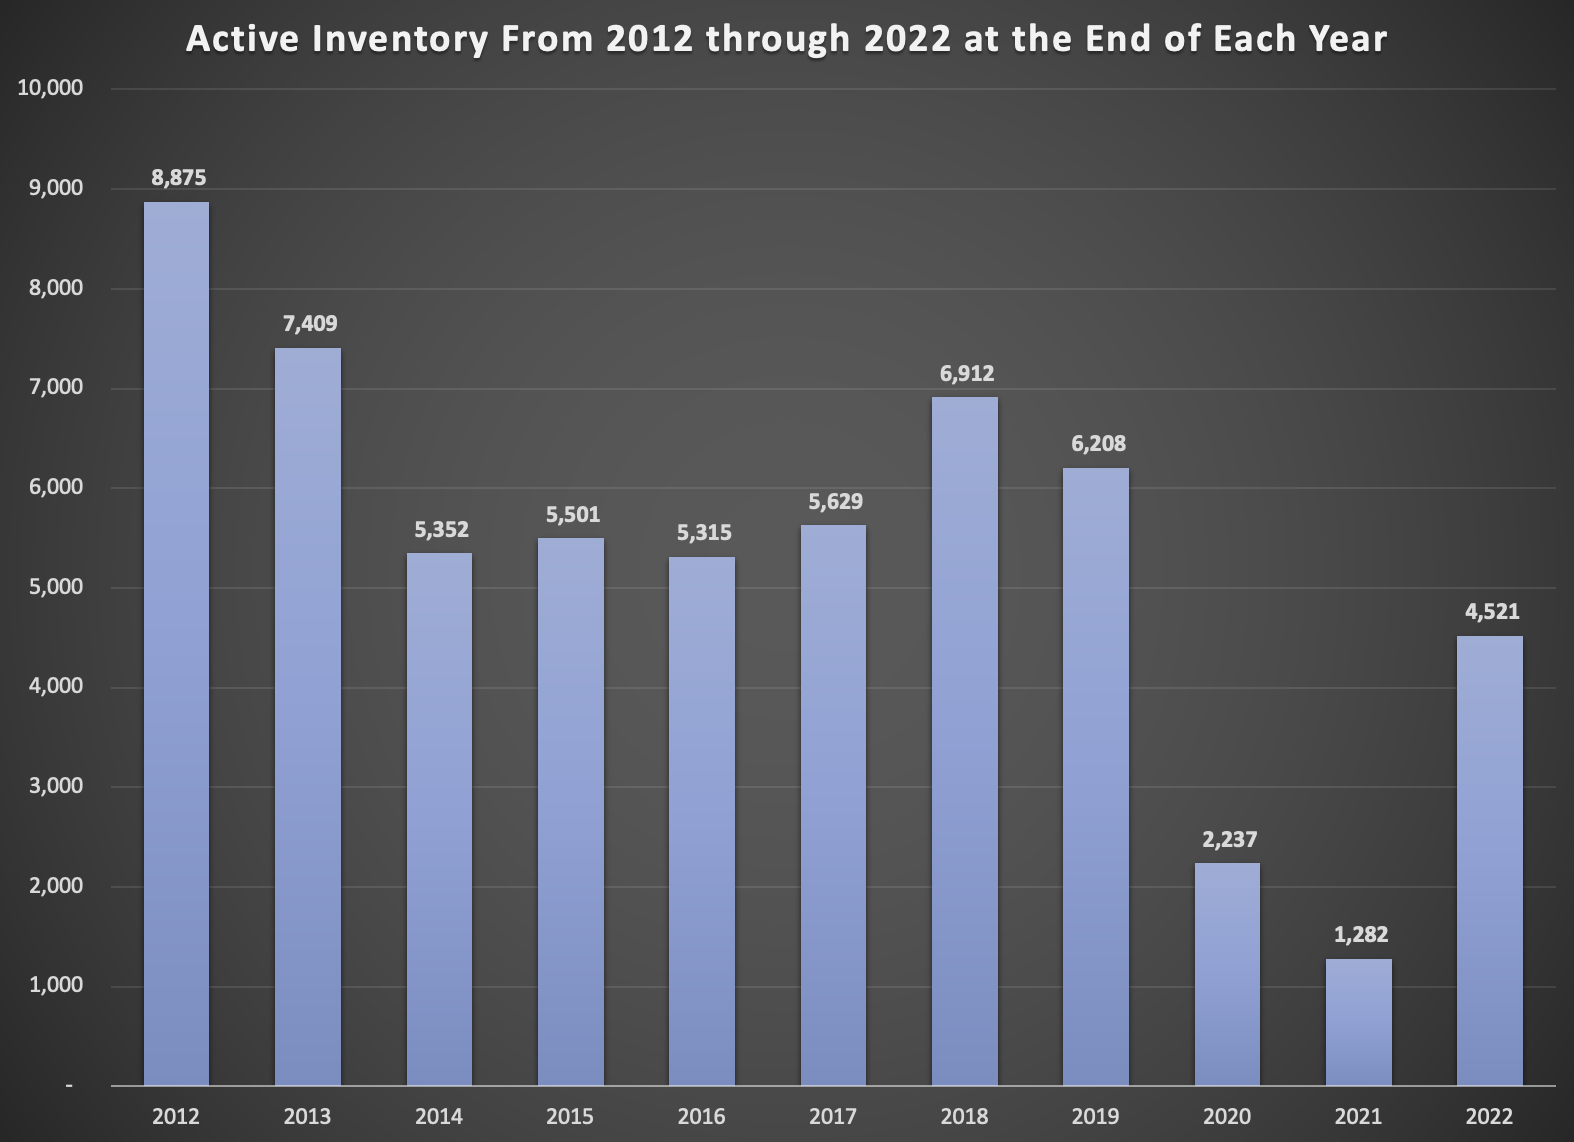
• At Year End 2022 there were 4,521 active homes for sale compared to the end of 2021 which had 1,282 homes – an increase of 253% of inventory over last year this time. This increase does tell us homes will last longer on the market and sellers will need to be open to competitive pricing and terms for 2023
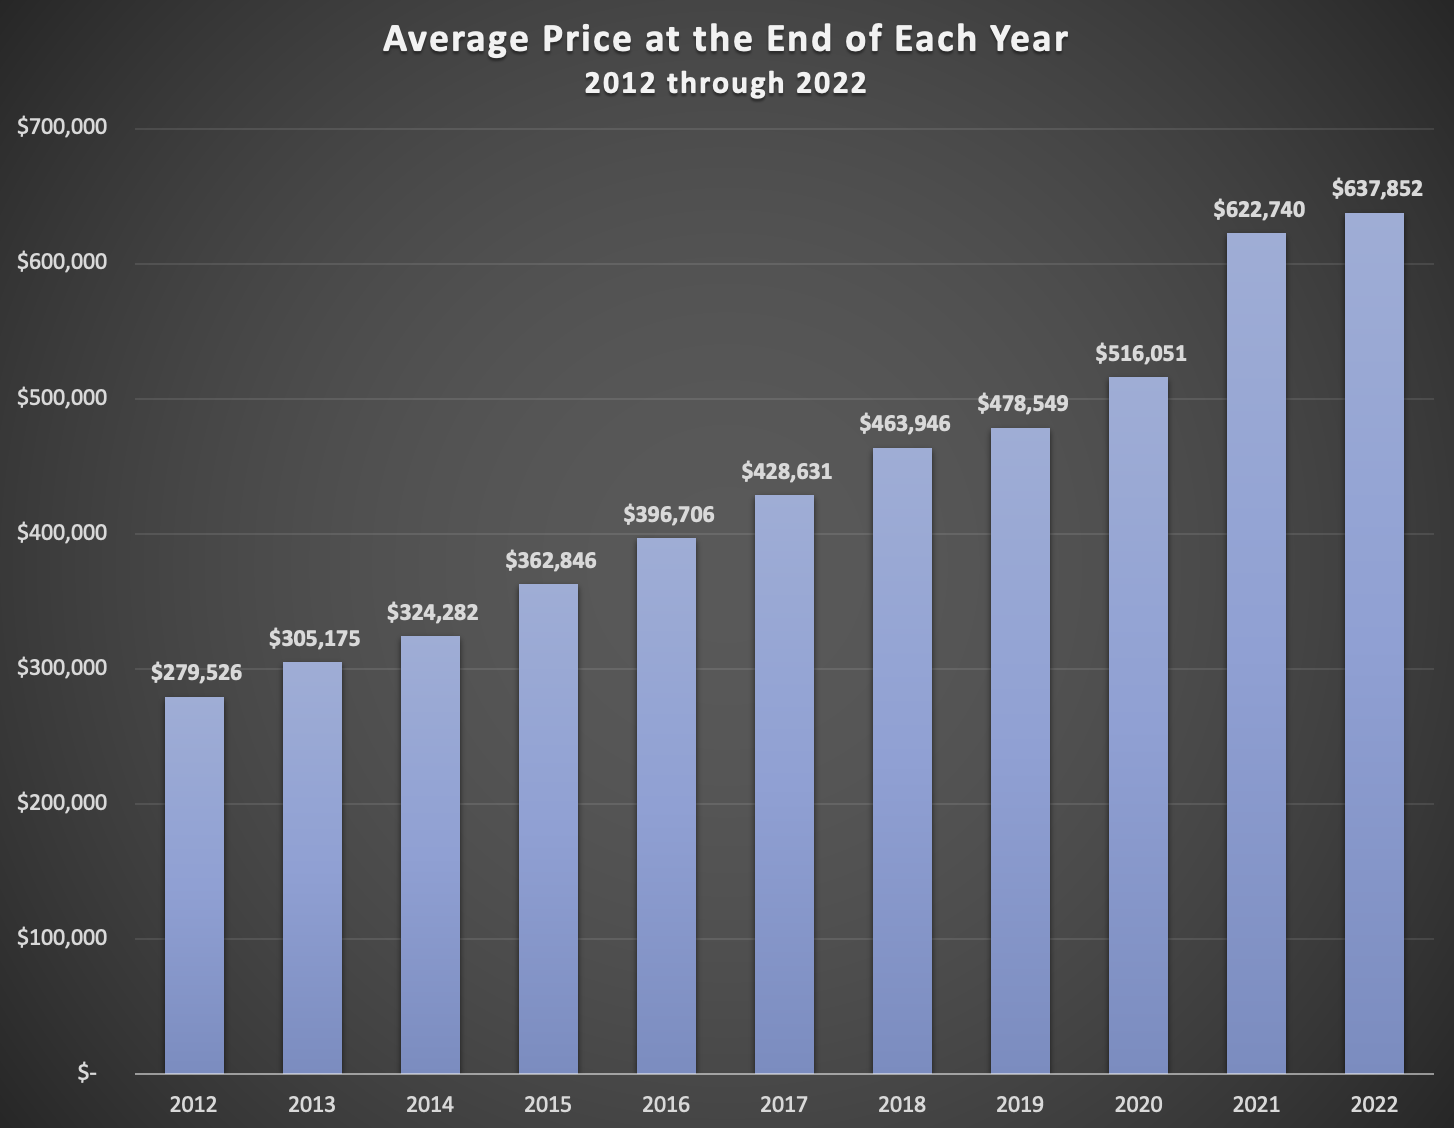
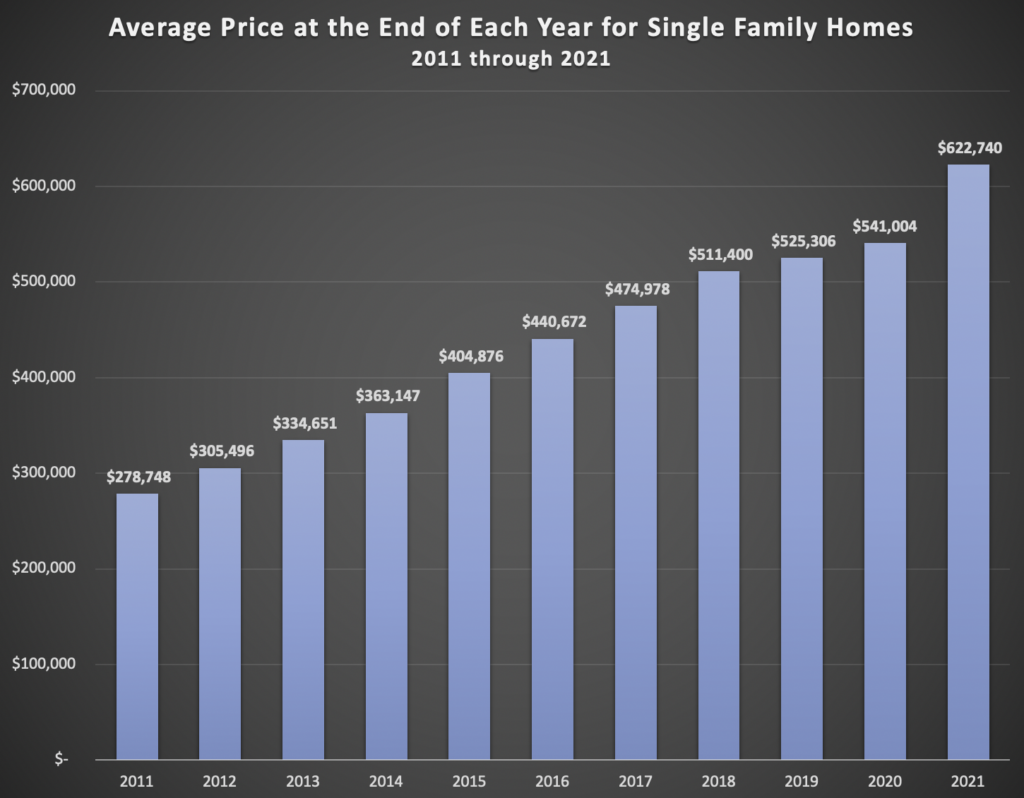
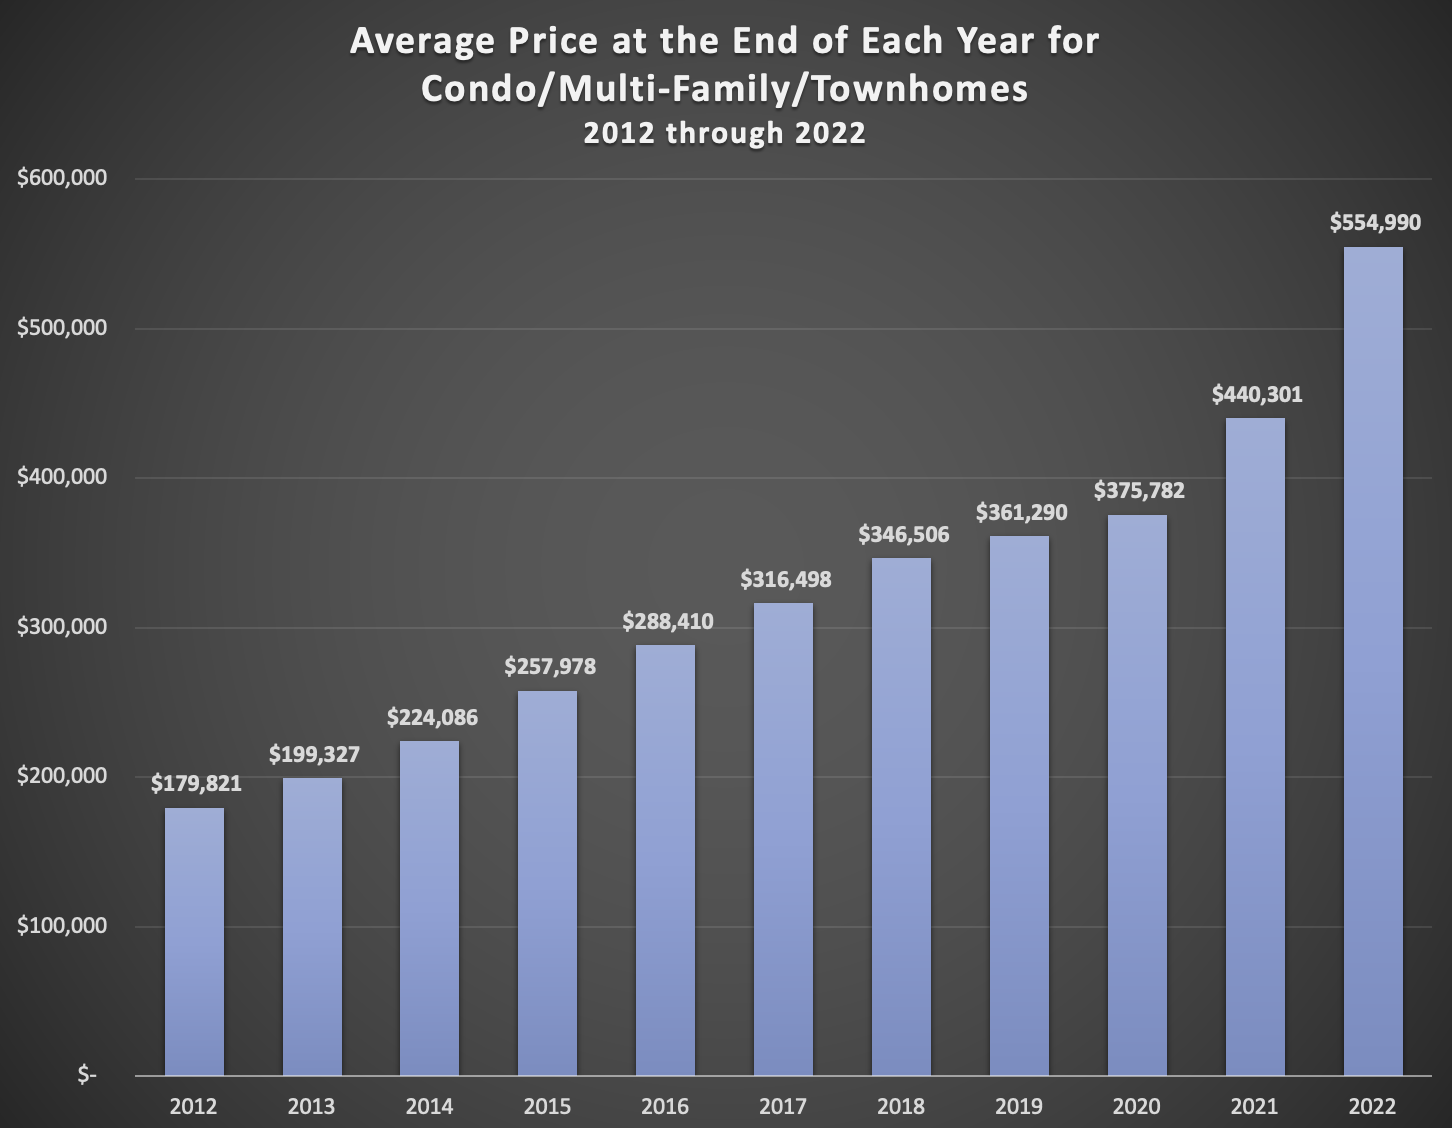
•The average price of a home in the Denver Metro Area ending 2022 is $637,852 for single family sold data compared to $622,740 ending 2021 year, which is an 2.4% increase in price for the mix of properties sold. Attached Units, i.e. condominiums, townhomes and multifamily sold data had an average price of $554,990 in 2022 compared to $440,301 at the end of 2021. By comparison, 2012 had a single-family average price in Denver of $305,496. This slower price trend will continue in 2023 with adjustments downward while interest rates remain higher than 2021 rates.
•The average days on the market ending the year of 2022 is 43 compared to 18 one year ago. The days on the market will increase as supply increases in 2023
•The selling price obtained compared to List price ending 2022 at a 98.6% to listing price and 2021 ended at 101.22% above listing prices.
•What this means is that buyers were willing to pay more than full price or more to buy a home in 2021, but that buyer behavior most certainly has changed for 2022 and will continue to change for 2023.
•The absorption rate for single family homes in the Denver Metro Area ending 2021 year-end inventories was a 1 week supply. Ending 2022 that absorption rate is now 7 week supply of homes! As the inventory increases the amount of supply increases. This inventory month supply will rise during the spring and summer seasons of 2023.
•The $500,000 to $750,000 price range had the most detached home sales with 17,127 homes closed in 2022 creating an absorption rate of 4.2 weeks of inventory. Check your price point to gain a more accurate supply and demand trend.
•Conversely the $1.5 million and above price range had a total of 1,781 homes closed in 2022, creating a current absorption rate of 15 weeks of supply. This is an increase of 388% in absorption rates from 12 months ago. Luxury Home Sales in the Denver metro area are most certainly slowing down in demand
Do You Wish You Would Have Bought More Real Estate in 2012?
Don’t wish the same thing in the year 2030!
In the last decade inventory has decreased from 8,875 in December of 2012 to 4,521 in the beginning of January 2023, a dramatic 41% decrease from that date. This has created the Denver real estate market to be one of the most aggressive home sales market and most certainly outperforming other national marketplaces. Watching the inventory will give you a very visual picture for the future real estate performance in Denver. We see inventories growing year over year by as much as 100% above the current level to approximately 9,000 to 9,500 total residential properties for sale in 2023 at the peak of the spring/summer selling season. However, until the inventory rises above the 15,000 unit level, the demand for housing will remain strong
The last 10 years have seen very dramatic Sold Data Swings
In the recent ten years of data, the number of units closed has gone from 47,565 in 2012 to 49.524 in 2022. This increase in closings represents a 4.1% increase in closed units over that period. As the inventory will rise in 2023 and beyond, the number of units closed will remain constant around the 49,000 to 52,000 number of closings over the next 5 years as buyer demand will remain constant in Denver. Builders are built out an anticipate new home starts to continue to rise in Denver absorbing some of those buyer demands, and the resale number of units closed indicates the short term will not see very much of a decrease in the number of closed units for 2023. Because of the lack of current available resale inventory, we do see an adjustment of number of units closed in 2023 to be about the same as 2022.
Average Price went up 128% Since 2012
A 128% increase in the average price of all properties in Denver for the last ten years makes homeowners very happy with their newfound equity position. This wealth growth in housing for Denver is unprecedented and the current market is making an adjustment as the increased prices will not be sustained due to the average buyers’ income which has not kept pace with the pricing of property for the 8 county Denver metro area and doubling of interest rates in 2022. Homeowners, on average, have more equity today than ever before in Denver. That equity position is causing homeowners to stay in their existing residences vs. making a move within the market. 2023 will find retiring property owners selling and taking advantage their assets growth and make a move to less expensive markets. Most homeowners in a move of equity move towards the locations of their families. Since many property owners in Denver moved to the Colorado market for opportunities, many times they are displaced from their core family location. Equity in homes gives flexibility to consider a move.
Average Price of Single Family Homes
108% Increase
Average Single Family Home Prices in the United States are at 370,700 USD in November 2022. Source: National Association of Realtors
Average Price of Attached Homes
209% Increase in 10 Years
Average Condominium prices in the US are at $331,000. Source: National Association of Realtors
2023 Housing Market Projections
For The Greater Denver Metropolitan are including counties Adams, Arapahoe, Boulder, Broomfield, Denver, Douglas, Elbert, and Jefferson
-
Prices have decreased in the last half of 2022 by 3% and the terms sellers have enjoyed have gone away in favor of buyer terms. This price decrease was a result of a correction off of what some buyers did to buy homes during the first half of 2022, with buyers’ bidding up over the value of the home by as much as 5-10% and providing sellers’ appraisal gaps to cover the full overage paid. For 2023, we do see a slight price adjustment downward in housing due to interest rate and prices still above the affordability of most buyers. The price reduction will be modest for some of the upcoming trends below, but sellers will have to be more realistic in their approach to setting their price. Remember, any prices retained in 2022 that offered bidding wars, removal of terms or forfeiture of funds did not establish new market value highs, but did have buyers willing to overpay to obtain a home in that market. Seller’s will need to consider accepting contingency terms and not set their expectations on aggressive bidding war prices that zealous buyers used to be the winner of the purchase of the home early in 2022, but still fresh in homeowners minds. These did not set values, but did establish a singular buyer to create a higher net to the seller to get the seller to accept their offer. Look to a 5-6% decrease in average pricing in 2023 on true 2022 market values, not inflated values.
-
Interest Rates have soared the early part of the second half of 2022 and will level off in 2023. We see trends for interest rates to hover around 5.875 to 5.99% in the spring of 2023. This is about a point lower off of the high level and historically lower than the lifetime average of rates. However, we have a full decade of buyers who have not experienced rates at this level and creating short term pathways of buy downs or seller concessions on closing costs plus seller concession for inspection objections will ease the pain of rates for the buyer pool.
-
Inventories will grow slowly, unless a seller is in a “need position to sell” you will see more sellers stay put and not enter the market. The thought that buyers should wait for lower rates and more homes becoming available will probably not occur in this decade. Why? Over 25 million homeowners have an existing 3% or lower mortgage rate on their home and unless they find themselves in one of the primary reasons to sell, such as, relocating to a new area, loss of job or obsolescence of the home, the normal homeowner will enjoy a low house payment and sit on their equity until homeowners actually need the money then they will sell. With supplies staying relatively low in relationship to demand, prices will not retreat and stay within 95% of today’s value.
-
Affordability of homes will bring new programs and governmental entities to the real estate table in 2023. What you will see are cities offering down-payment assistance programs for first time home buyers, educators and first responders. These municipal programs attract buyers to their cities. Secondly, you are liable to see more governmental oversight on land to create affordable housing. Cities and Counties will utilize new attractive down payment and lowering of interest rates programs for affordable housing programs to attractive specific groups, like teachers or first time home buyers to their areas.
-
New Construction has not kept pace with the demand of buyers wanting new homes and will lag behind in 2023 for inventories creating a price stability in housing. There will always be some standing inventory in a shifting market, and this is a good time to buy a new builder home, but these inventories are absorbed very rapidly and 2023 will be another year of writing a contract and waiting for the home to be finished as a buyer.
-
Home Designs and Workers location to their employment will create movement in housing next year. The workforce will go back to work in 2023 for at least 3 days per week and the two family designed homes will continue to grow in numbers as parents and children decide to split the higher costs of housing.
-
The standard for supply and demand to create an equilibrium in buyers and seller has historically been identified by economist as a 6 month’s supply. We would suggest that with the increase in the prices of homes over the last 5 years and the result of lower inventories predicted, a 3-4 month supply will be closer to a balanced market where buyers and sellers are in an equal negotiating position


